
The best-selling features
The best-selling features
Like most areas in life, the features home buyers most desire are subject to changing fashion
and priorities. During the pandemic, everyone wanted bigger homes and more outside space
and the most desirable features of all were homes offices and garden rooms.
Now we are all moving back into our cities, the home office is not being used quite as much as it once
was and those garden rooms that we lusted after that we often turned into gyms are no longer the
envy of our friends because exercising on your own gets boring!
So what are our priorities now?
Research shows that there are currently three key features when it comes to selling your home and
these are:
A breakfast bar – just as it sounds, it is a casual spot where you can eat breakfast. It is somewhere
between a large shelf and a kitchen island and will often be found secured to a wall. Because it adds
another distinct area, it is part of the ‘broken plan living’ trend and is especially useful in smaller
kitchens where it will add extra eating or prep space. And, best of all, it won’t cost you a fortune. You
can even build your own using a large pre-made shelf from your local DIY store. And research shows
nearly 14% of homes that have recently sold have one.
A high EPC rating – the combination of high energy prices and an ever more environmentally
conscious public have meant a home’s energy performance is becoming increasingly important. And,
with around 20% of the UK’s emissions coming from our homes, the Government is pushing hard to
get our housing stock to net zero and that may mean the legally required improvements that are
coming for the lettings industry will soon be applied to normal homes too.
The surprise is that the data shows that EPC ratings are in second place as a desirable feature to
breakfast bars, with just under 13% of recently sold homes having an EPC rating of C or above.
A kitchen island – in third place, it’s back to the kitchen and the ever-popular island. It is the sociable
centre of the kitchen and that may explain its resurgence in the best feature rankings after the
isolation of the pandemic era came to an end. It needs a decent-sized kitchen/home, so is something
of a luxury item for many. If you’ve got the space, it’s easy to see why they are so popular, as they can
house lots of extra cupboards and a huge amount of extra workspace. They also tend to be visually
appealing, too. Islands feature in 12.6% of successful sales.
The also-rans include freestanding baths at 11.1%, doer-uppers at 10.4%, wooden beams came in at
9.7%, dressing rooms at 9.5% and high ceilings at 9.2%.
Some of the items at the opposite end of the scale were pools at 5.6% and, as we referred to earlier,
large gardens are clearly out of fashion at 7.1%.
But remember, if you are selling your home, just try and make the most of what you’ve got. It’s more
important to make it sparkle rather than going to the time and expense of squeezing an island into a
kitchen that is too small, as it will only make it look cramped and reduce its desirability.
Breakfast bar image courtesy of Litfad
Scandinavian Bar Table
www.litfad.com

End of year market report
End of year market report
As 2024 draws to a close, it is a very mixed picture, the sales market, though, remains resilient
and some of the data is showing signs of real growth.
Zoopla is reporting that, despite affordability pressures, house prices rose by1.0% over the last 12
months. They also report the supply of properties for sale is continuing to improve, with buyer choice
now at its highest level since 2014. However, the portal warns that the increase in supply means that
the market is becoming more price sensitive and so sellers need to adjust their expectations to secure
deals.
Nationwide’s figures, on the other hand, show house prices grew by as much as 1.2% last month
alone - their fastest rate for November for two years. Annually, they were up by 3.7% and mortgage
approvals are approaching pre-pandemic levels, suggesting underlying market strength. Halifax’s
prices were up by a very similar 1.3% and 4.8% year-on-year.
Rightmove’s figures, in contrast, show a monthly fall of 1.2% and relatively sluggish annual growth of
1.2%. There are also some marked variations across the country, with northern regions generally
outperforming the southern ones in terms of both activity and price growth. The North East had the
highest annual rise at 4.2% and London came bottom at -0.8%. However, the differences between the
boroughs in the Capital are even greater than they are for the regions, with over a 10% swing
between top and bottom. Merton’s prices, for example, have risen by 7.2% over the last twelve
months, whereas Richmond’s have fallen by 3.1%.
What all the indices do agree on is that it’s first-time buyers that are currently some of the most active
as they rush to beat the change in stamp duty, whose threshold will come down from £425,000 to
£300,000 on April 1st next year.
This month’s mixed data is not unexpected in a market that is coming back to life after an election, a
gloomy budget and still adjusting to higher mortgage costs.
HOUSE PRICES AND STATISTICS
November’s indices are very mixed but should settle into a more discernible pattern in the New Year.
Nationwide: Nov: Avge. price £268,144. Monthly change +1.2%. Annual change +3.7%
Halifax: Nov: Avge. price £298,083. Monthly change +1.3%. Annual change +4.8%
Land Registry: Sept: Avge. price £291,828. Monthly change -0.3%. Annual change +2.9%
Zoopla: Oct: Avge. price £267,200. Annual change +1.0%
Rightmove: Nov: Avge. price £366,592. Monthly change -1.4%. Annual change +1.2%
RENTAL MARKET
The rental market has reached something of a turning point as growth moderates significantly.
HomeLets latest data shows average UK rents at £1,307 per month, but annual growth has
slowed to 2.2% - the lowest rate since 2021.
In London, rents now stand at £2,151 per month - up just 1.1% from last year – a dramatic fall from
the 8.7% growth recorded 12 months ago. There are, as with sales, wide regional variations, with
West Midland’s annual rise the biggest at 8.4%.
In a development that will be welcomed by many, Zoopla says the supply-demand imbalance is finally
showing signs of improving, with letting agents reporting 12% more properties available compared to
last year. However, this is still nearly a fifth below pre-pandemic levels. At the same time, demand has
normalised, coming down by 29% from last year's peak but still running 31% above pre-pandemic
levels.
Looking ahead, rents are forecast to rise by 4% in 2025, with stronger growth expected in more
affordable areas whilst major cities face increasing affordability constraints. The cumulative impact of
recent rises - adding £3,240 to average annual costs since 2021 - continue to shape market
dynamics, with almost 30% of private renters now receiving rental support through Universal Credit.

Base rate down but mortgages up
Base rate down but mortgages up
Mortgage rates were already falling when the Bank of England’s Monetary
Policy Committee voted by 8 to 1 to cut rates for the second time in 2024.
Labours spending plans though may now slow future reductions.
The governments official forecaster, the Office for Budget Responsibility (OBR), has
warned that mortgage rates may now remain higher than previously expected. That
is because in Rachel Reeves; budget she announced £40 billion in new taxes and
plans to borrow an extra £32.3 billion over the next five years. When the government
needs to borrow that level of money, it pushes up the cost of finance for everyone,
including mortgages for homeowners.
As a result, many of the big lenders are currently raising mortgage rates, typically by
around 0.3%, rather than cutting them. It means the Bank of Englands next interest
rate decision will be even more closely watched as it weighs up improving economic
data against the Government’s spending plans.
And, with the surprise rise in last month‘s inflation to 2.3%, the financial markets are
busy adjusting their predictions for 2025.
Most are now betting that, when Reeves’ spending plans are combined with Trump’s
election win, the base rate will now come down more slowly than originally thought
and, after it reaches 4.5%, it will then remain there for an extended period.
Below is a selection of this month’s best buys from Moneyfacts.co.uk:
Two-year fixed rates: 4.34% from Nationwide BS. Product fee £999. 60% LTV.
4.54% from first direct. Product fee £490. 60% LTV.
Three-year fixed rates: 4.29%4.29% from Nationwide BS. Product fee £999. 60%
LTV.4.39% from first direct. Product fee £490. 60% LTV.
Five-year fixed rates: 4.14% from Nationwide BS. Product fee £999. 60% LTV.
4.29% > from first direct. Product fee £490. 60% LTV.
Discounted variable: 4.49% For 2 years. From Progressive BS. Product fee £0.
75% LTV.
4.59% For 2 years. From Scottish BS. Product fee £995. 60% LTV.
BUY-TO-LET (BTL)
Best two-year fixed rate: 3.24% from The Mortgage Works. Arrangement 3.00%
Advance. 65% LTV.
Five-year fixed rate: 3.69% from The Mortgage Works. Arrangement 3.00%
Advance. 65% LTV
Best Discounted variable: 4.90% For 2 years. From Monmouthshire BS.
Arrangement 2.00% Advance. 75% LTV.
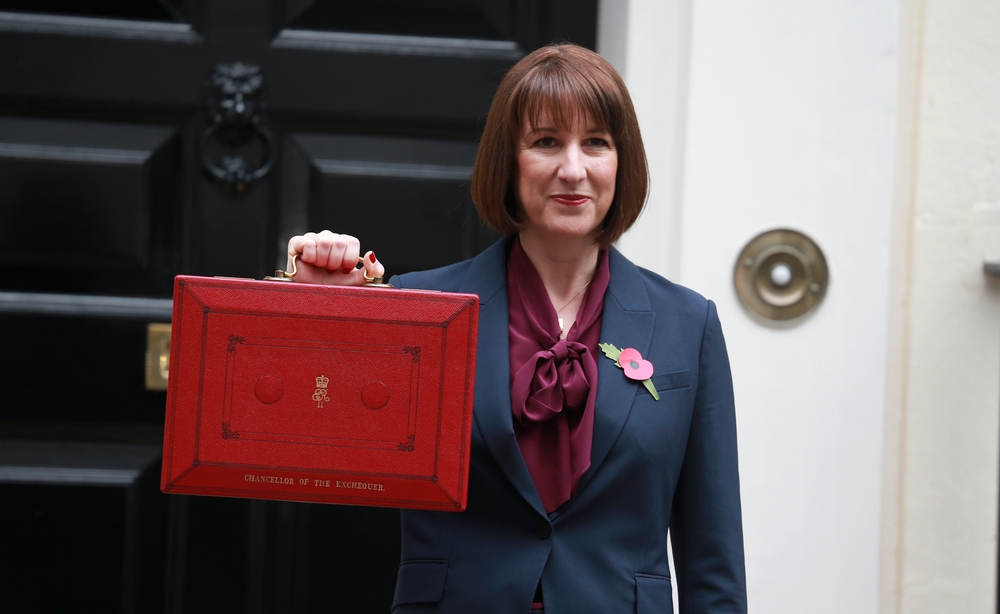
Budget Report
Budget Report
The Chancellors autumn budget has set the stage for a number of changes in
the property market, with many buyers and sellers already adjusting their
plans for the year ahead.
The increase in stamp duty for landlords and second home buyers from 3% to 5% is
already in effect, but there was some more positive news too. Capital gains tax on
residential property will remain at its current levels, and there will be a £5 billion
investment package to boost housing supply and the 95% mortgage guarantee
scheme will become permanent, offering ongoing support for first-time buyers.
Next March, however, will see the end of the current stamp duty holiday, with first-
time buyers' tax-free threshold dropping from £425,000 to £300,000, and other
buyers' threshold falling from £250,000 to £125,000. This gives buyers just a few
months to take advantage of current rates, and early signs suggest many are
planning to do just that.
The impact of the stamp duty changes will vary significantly by region. While buyers
in more expensive areas such as London and the Southeast will face higher
purchase costs post-March, those in lower-priced parts of the country will see little
change.
The new 5% stamp duty premium for buy-to-let and second homes though may deter
landlords from further investments, but those staying in the market could benefit from
robust rental demand and yields as supply levels are reduced.
In the short-term, the impact might be greater on second-home owners as they were
already nervous about being targeted for substantial rises in council tax, especially in
tourist areas.
Reeve’s plans in her budget for the housing market weren’t all about raising taxes,
though, she also announced a £5 billion house-building package, including £500
million for affordable homes and £3 billion to support smaller builders and the Build
to Rent sector. Another £1 billion has been allocated to the removal of dangerous
cladding.
It’s the kind of ambitious investment programme that many from inside and outside
the property world have been demanding for some time.
Overall, however, it was a fairly mixed budget for the sector but not as bad as many
feared. The majority are still digesting its implications and so it will be a while before
we see its true impact on the market. For first-time buyers, however, there is no time
to wait. The combination of the stamp duty deadline and the predicted mortgage rate
cuts means they are likely to be very active over the next few months. And, although
they will lose their stamp duty discount in March, the prospect of Rachel Reeves’ 1.5
million new homes should offer hope of a brighter future to all aspiring young
homeowners.

Mortgage rates are falling
Mortgage rates continue to fall as interest rate cut expectations ramp up, with
Bank of England Governor Andrew Baileys more bullish recent comments
marking a clear shift in tone.
This follows the Banks first rate reduction in four years on August 1st, when rates
were lowered to 5% from a 16-year high of 5.25%.
Major lenders including HSBC, Halifax, NatWest and Barclays have responded by
cutting mortgage rates further. While average two and five-year fixed rates remain
above 5%, at 5.38% and 5.05% respectively, a number of sub-4% deals are
available for those with a decent deposit. Swaps rates (the rates at which banks
borrow money) however have increased by around 0.4% since mid-September and
so some lenders have started increasing their rates.
The next Monetary Policy Committee (MPC) meeting is on November 7th and will be
closely monitored. Ultimately, the decision will hinge on upcoming economic data,
particularly inflation figures and labour market reports. Core inflation and services
inflation both rose in August, but wage growth has slowed to 5.1%, its lowest level in
over two years, although the war in the Middle East may well push up oil prices and
business costs.
The money markets are now factoring in one more cut in 2024 in November,
followed by several more in 2025, with the base rate finishing the year at 3.25%.
Below is a selection of this month’s best buys from Moneyfacts.co.uk:
Two-year fixed rates: 4.09% from first direct. Product fee £490. 60% LTV.
4.12% from Nationwide BS. Product fee £999. 60% LTV.
Three-year fixed rates: 4.09% from first direct. Product fee £490. 60% LTV.
4.14% from Nationwide BS. Product fee £999. 60% LTV.
Five-year fixed rates: 3.79% from first direct. Product fee £490. 60% LTV.
3.84% from Nationwide BS. Product fee £999. 60% LTV
Discounted variable: 4.49% For 2 years. From Progressive BS. Product fee £0.
75% LTV.
4.59% For 2 years. From Scottish BS. Product fee £995. 60% LTV.
BUY-TO-LET (BTL)
Best two-year fixed rate: 3.24% from The Mortgage Works. Arrangement 3.00%
Advance. 65% LTV.
Five-year fixed rate: 3.69% from The Mortgage Works. Arrangement 3.00%
Advance. 65% LTV
Best Discounted variable: 4.90% For 2 years. From Monmouthshire BS.
Arrangement 2.00% Advance. 75% LTV.

What makes us move?
What makes us move?
Moving house is a major upheaval. Most of us do it around 3 or 4 times in our
lives, or every 5 to 7 years. Around a million households moved home last
year, so what is it that triggers this desire to move on?
1. More space/growing family: There are not many who don't want a bit more
space. The decision to upsize can sometimes be provoked by visits to friends' and
familys more spacious homes, but the most common reason is a new baby. And it
doesnt just end there - as the kids get older, they take up even more space. When
you think there were 598,400 births in 2023 in England and Wales (source: ONS) -
there are plenty of reasons to move.
2. Being closer to family: Most of us like to be near our families, especially when
we start one of our own or our parents need some help as they get older and, as a
bonus, it can help to reduce the childcare bill. The truth is that not many of us have
wandered far from the family home in the first place - according to a recent survey -
typically, we only travel 40 miles between each move and rarely end up more than
70 miles from our place of birth.
3. School catchment area/empty nest for parents: Living in the catchment area of
good primary schools is essential and then, when the children get closer to
secondary school age, they may have to move again. 15% of parents with children
aged four to 18 claim to have moved house for this reason (source: Rightmove),
although the real figure may be much higher. And when its all over and the children
leave home, it can be the catalyst for another move, as both the need for space and
a home in an expensive catchment area are no longer there.
4. Change of job or remote work: If the perfect job comes up in another town, it
may be necessary to move. However, with the rise of remote work since the
pandemic, many are now moving for lifestyle reasons rather than job proximity.
This shift has led to increased interest in rural and suburban areas, as city-centre
proximity becomes less crucial for many workers.
5. Bored/itchy feet: A recent survey discovered that, typically, we get bored of our
properties after a period of six years and eight months. The younger you are, the
sooner you start to get itchy feet, with 25-34 year olds starting to think about moving
on after three years and nine months, whereas those over 55 don;t do so for eight
years and six months. The survey also found that 65% of all home moves were
initiated by females, because they had become dissatisfied by their current homes.
6. Divorce/separation or a new relationship: Divorce is another very common
reason for selling a house. The latest figures from the ONS show there were 80,057
divorces in England and Wales in 2022 (the last year for which complete data is
available). On the flip side, there were 246,897 marriages, but neither figure takes
into account any newly cohabiting or separating couples.
7. Downsizing/release equity: People often downsize in order to cut down on their
outgoings or release capital. Because pensions and savings are producing such low
returns, the vast majority of retirees are using the equity tied up in their home to help
fund their retirement. According to a study, 1.5 million retirees are planning to
downsize over the next five years, which would equate to 25% of all house sales.
8. Death: Its not a happy thought, but 598,000 people died in England and Wales in
2023 (source: ONS). Not all of them were homeowners and many would have been
survived by their partners, but even so, each year it results in a substantial number
of properties being put on the market.
Two-up two-downs are the hottest properties
Two-up two-downs are the hottest properties according to Zoopla
‘Two-up two-down’ has traditionally been an almost derogatory term. It implies
a small cramped house at the very bottom of the housing ladder. However, in
recent years its fortunes have changed and it has had something of a
renaissance, so much so that Zoopla says it is now the most in-demand home
type.
According to their data, 49% of their sales in England and Wales were agreed within
30 days of the property being listed. And the average is just 27 days. 4-bedroom
properties, on the other hand, take 40 days or 33% more time to get an agreed sale.
So why, exactly, are they selling so fast?
Zoopla says the answer is that 2-bed terraced homes appeal to a wide variety of
buyers. They are a good value-for-money option for first-time buyers with limited
funds as well as being a popular choice for downsizing empty-nesters.
They’re also surprisingly rare. Only 7% of homes that came on the market in the last
3 months were 2-bed terraces, so demand is outstripping supply.
What Zoopla don’t say is that they are often bought as an alternative to a flat. That’s
because, unlike flats, most are freehold and don’t have service charges or managing
agents. They are also, by their very nature, more private, many have gardens and
some even have off-street parking. Nor, post the Grenfell tragedy, do they have any
cladding to worry about.
And it doesn’t stop there, they are more flexible, too. Attics offer the chance of more
storage space or can be converted and, for those with the space they can be
extended outwards, too.
Money is another key aspect. Higher borrowing costs mean that buyers are having to
trim their budgets (and their expectations). People who wanted a typical 3-bed family
home are instead considering a 2-up 2-down, as they are not only cheaper to buy,
they are cheaper to run.
And that is reflected in their rising popularity. They have, Zoopla say, been sought
after in the more affluent areas for some time but are now increasingly in demand in
more affordable areas as well.
As they say, they are canny those Scots, and that is where they are selling the
fastest, with sales being agreed just 14 days after they are listed. And, they love
them in the North West too, with England’s fastest sales times at 21 days.
So, next time you hear someone speak about a house a 2-up 2-down in a
disparaging manner, you can tell them that, actually, they are the hottest ticket in
town when it comes to selling them!
Oh, and for much the same reasons, they make great rental properties too.

Late summer bounce
Late summer bounce
With the election over and the base rate looking like it is finally on the way down,
there has been a bit of a bounce in the housing market this August and that was
despite it being peak holiday season.
Rightmove is reporting that the number of potential buyers enquiring with agents about
homes for sale has jumped by 19% when compared to August last year. And that’s up from
11% in July.
Lender Nationwide is reporting that house price rises have now reached 2.4% on an annual
basis, which is the fastest pace since December 2022.
And Halifax says house prices increased by 0.3% in August, after a 0.9% rise in July.
Tim Bannister Rightmove’s Director of Property Science says:
“The first Bank Rate cut since 2020 has sparked a welcome late summer boost in buyer
activity. While mortgage rates aren’t yet substantially lower since the rate cut, the fact that
the long-hoped-for first cut has finally arrived, and mortgage rates are heading downwards,
is positive for home-mover sentiment.
“As the summer holiday season comes to an end, the conditions are there for a more active
autumn market.”
And Robert Gardner, Nationwide's Chief Economist, says of the road ahead:
“Providing the economy continues to recover steadily, as we expect, housing market activity
is likely to strengthen gradually as affordability constraints ease through a combination of
modestly lower interest rates and earnings outpacing house price growth.”
There is though the looming spectre of Rachel Reeves' much-publicised autumn budget and
Keir Starmer’s warning of ‘pain to come’. It remains to be seen exactly what it will mean for
the property market but in the meantime, it may at least give some movers pause for
thought.
HOUSE PRICES AND STATISTICS
July's rises have continued into August, despite concerns over the upcoming budget.
Nationwide: Aug: Avge. price £265,375. Monthly change -0.2%. Annual change +2.4%
Halifax: Aug. Avge. price £292,505. Monthly change +0.3%. Annual change +4.3%
Land Registry: June: Avge. price £287,924. Monthly change +0.5%. Annual change +2.7%
Zoopla: July: Avge. price £266,400. Annual change 0.5%
Rightmove: Aug: Avge. price £367,785. Monthly change -1.5%. Annual change +0.8%
(asking prices on Rightmove)
BUY-TO-LET
With the Renters' Right Bill now making its way through parliament, the prospect of the
ending of no-fault evictions and higher Capital Gains Tax is leading to significant numbers of
landlords leaving the market.
According to analysis by data firm TwentyCi, the number of ex-rental properties for sale in
central London has hit a 10-year high as landlords flee Labour’s threatened crackdown.
However, if as expected, CGT is aligned with landlords’ income tax rates, it may soon
become more cost-effective for them to stay put.
In addition, the shortfall in rental property is likely to push up rents even further. Homelet’s
rental index shows the average rent was up again last month by 1.3% to £1,325. That’s a
rise of 5.1% on an annual basis.
After 3 months of falls, the biggest rise though was in London, where rents jumped by 2.2%
in August. The average London rent is now £2,148 with annual growth currently running at
just 0.1%.

Housing market on the move again
Housing market on the move again
The short hiatus caused by the election is now over and the various indices are
reporting house prices are growing once more and a clear trend is emerging.
Nationwide’s data shows the average price rose by 0.3% in July, with the annual rate of
growth going from 1.5% to 2.1% in July, which is its fastest pace since December 2022.
Halifax had month-on-month growth of 0.8%. Their annual growth was the highest since the
start of the year at 2.3%.
The cut in the Bank of England’s base rate came too late for it to have any discernible effect
on any of the indices’ current figures.
Both Halifax and Nationwide though have since cautioned that despite the cut, borrowing
costs remain high and house price growth will continue to be subdued while affordability
constraints remain.
Amanda Bryden, Head of Mortgages, Halifax, said:
“Last week’s Bank of England’s Base Rate cut, which follows recent reductions in mortgage
rates, is encouraging for those looking to remortgage, purchase a first home or move along
the housing ladder. However, affordability constraints and the lack of available properties
continue to pose challenges for prospective homeowners.”
And Robert Gardner, Nationwide's Chief Economist, said:
“Investors expect Bank Rate to be lowered modestly in the years ahead, which, if correct,
will help to bring down borrowing costs. However, the impact is likely to be fairly modest as
the swap rates which underpin fixed-rate mortgage pricing already embody expectations that
interest rates will decline in the years ahead.”
Rightmove’s index was the only one to report a fall (-0.4%), although their index is based on
asking prices which normally fall over the quieter summer months as sellers chase fewer
buyers. The price data then won’t appear in the other indexes for several months until those
properties are actually sold.
HOUSE PRICES AND STATISTICS
There were steady rises in July and annual growth is slowly creeping up.
Nationwide: July: Avge. price £266,334. Monthly change +0.3%. Annual change +2.1%
Halifax: July. Avge. price £291,268. Monthly change +0.8%. Annual change +2.3%
Land Registry: May: Avge. price £285,201. Monthly change +1.2%. Annual change +2.2%
Zoopla: June: Avge. price £265,600 . Annual change 0.1%
Rightmove:July: Avge. price £373,493. Monthly change -0.4%. Annual change +0.4%
(asking prices on Rightmove)
BUY-TO-LET
Although rents continue to rise, there has been a sharp slowdown in London. The average
was up by 0.7% to £1308 in July, which is an annual rise of 5.2%. In London, falls that
started in late spring are continuing. The Capital’s rents were down by 0.1% to £2,101 and
annually they were down by 0.4%.
The falls though were far more pronounced in central areas, such as Westminster (-4.8%),
Tower Hamlets (6.7%) and Wandsworth (-11.2%). In contrast, in Bromley, rents were up
6.4% and by 10.5% in Redbridge and Waltham Forest.
In other news, the looming Renter’s Reform Bill has led to a lot of speculation in the media
that there could be a mass exodus of landlords. A recent report from RICS, however, shows
although instructions to their members from Landlords had fallen, the reduction was more of
a trickle than a torrent and nowhere near the numbers seen 12 months previously.

Base rate finally on the way down
Base rate finally on the way down
Last month the Bank of England finally voted to cut the base rate by 0.25% to
5.00%, giving a boost to the entire property sector, from landlords to first-time
buyers and second-steppers. Mortgage rates had already come down in
anticipation of the move, with a number of 5-year fixed rates just under the 4%
mark.
There will be three further Bank of England meetings this year and the money
markets are anticipating one or possibly two more cuts. Inflation, however, is
reportedly starting to creep up again and that may give the Bank pause for thought.
Industry commentators are also warning that despite the prospect of a falling base
rate, ultra-low rates a thing of the past and that it will still be a shock for the many
borrowers currently coming off 5-year fixed rate deals.
Below is a selection of this month’s best buys from Moneyfacts.co.uk:
Two-year fixed rates: 4.54% from Yorkshire BS. Product fee £1,495.00. 75% LTV.
4.59% from first direct. Product fee £490. 60% LTV.
Three-year fixed rates: 4.49% from first direct. Product fee £490. 60% LTV.
4.49% from Yorkshire BS. Product fee £1,495. 75% LTV.
Five-year fixed rates: 4.24% from first direct. Product fee £499. 60% LTV
4.32% from Nationwide. Product fee £999. 60% LTV.
Discounted variable: 4.84% For 2 years. From Progressive BS. Product fee £0.
75% LTV.
4.85% For 2 years. From Reliance Bank. Product fee £1,094. 75% LTV.
BUY-TO-LET (BTL)
Best two-year fixed rate: 3.49% from The Mortgage Works. Arrangement 3.00%
Advance. 65% LTV.
Five-year fixed rate: 3.84% from The Mortgage Works. Arrangement 3.00%
Advance. 65% LTV
Best Discounted variable: 5.00% For 2 years. From Monmouthshire BS.
Arrangement 2.00% advance. 75% LTV.