Pre-election market update 2024
Although many people are still waiting for the base rate to start coming down before making a move, May is traditionally one of the strongest performing months in the housing calendar. It has set price records in 12 of the previous 22 years and, this year, prices still made gains, but only relatively small ones. Rightmove’s property index rose by 0.8%, edging up to a record £375,131, which is just 0.6% higher than prices were this time last year.
As has been the case for some time, it was the top-of-the-ladder homes – four and five-bed properties - that saw the most growth. Annually, their prices rose more than twice as fast as the average at 1.3%.
Halifax’s figures, in contrast, showed there was a slight fall in May, but had stronger annual growth of 1.5%. Together, though, they paint a very similar picture. As Amanda Bryden, Head of Mortgages, Halifax, says:
“Market activity remained resilient throughout the spring months, supported by strong nominal wage growth and some evidence of an improvement in confidence about the economic outlook. This has been reflected in a broadly stable picture in terms of property price movements, with the average cost of a property little changed over the last three months.”
She goes on to say, “While homebuyers and those remortgaging will continue to respond to changes in borrowing costs, set against a backdrop of a limited supply of available properties, the market is unlikely to see huge fluctuations in the near term.”
We are, however, approaching an election. Traditionally, that means the market is likely to go quiet in the run-up. There will then be a hiatus for a week or two, after which the market tends to return to exactly where it left off.
HOUSE PRICES AND STATISTICS
Despite some variation in their monthly figures, the latest indices show annual price growth slowly converging to between +1% to +1.5%.
Nationwide: May: Avge. price £264,249. Monthly change +0.4%. Annual change +1.3%
Halifax: May. Avge. price £288,688. Monthly change -0.1%. Annual change +1.5%
Land Registry: Mar: Avge. price £282,776. Monthly change +0.7%. Annual change +1.8%
Zoopla: Apr: Avge. price £264,300. Annual change -0.1%
Rightmove:May: Avge. price £375,131. Monthly change +0.8%. Annual change +0.6% (asking prices on Rightmove)
BUY-TO-LET
Rent rises pulled up sharply last month, with monthly growth dropping from 1.6% in April to 0.2% in May. The average rent is now £1,297, a rise of 6.9% when compared to this time last year. In London, the slowdown was even more pronounced, with annual growth falling to 6%. During the same period last year, the Capital’s rental growth was in double digits.
As ever, there are some very wide variations between the postcodes. So, if you’re a tenant in Ealing (+16.4%), Barking, Dagenham and Havering (+13.0%), Croydon (+10.8%) or Richmond (+10.6%) it won’t feel much like a cooling market. (Source: Homelet's Rental Index).
According to Zoopla’s data, rental inflation is now at its lowest for more than two and a half years and they have said they expect the slowdown to continue for the remainder of 2024. They also note, however, that supply levels are slowly improving - the average number of homes for rent per estate agent has increased by almost a fifth (18%) over the past year, while demand has come down by 25%. The number of available properties, though, is around 33% below pre-pandemic levels and there are still as many as 15 households chasing every available rental home.
Inherited money and property prices
The UK’s property market is being increasingly shaped by inherited property wealth. According to a new report by cross-party think tank Demos, we are entering a "new age of inheritance," with inter-generational gifts totalling more than £100 billion per year. It is, though, a trend that has been building for some time. Since 1979, inheritances have been roughly doubling every 20 years and they are expected to double again in the next 20.
A large proportion of those intergenerational gifts are the result of inheritances from property. Approximately 10% of homes sold are from probate, i.e. from the estate of someone who died. In 2022, total house sales were £295.7bn. Probate properties would have accounted for around £29.57bn of that. Another significant chunk comes from the much-publicised “Bank of Mum and Dad’ who often generate the cash by releasing equity in their homes - an approach that enables their offspring to get their hands on their inheritances early. The Equity Release Council reported that lending in the sector reached as high as £6.2 billion in 2022.
To give you an idea of how that works on an individual level, Demos found that households headed by people born in the 80s expect to inherit an average of almost £250,000 during the course of their lives. That’s the equivalent of eight years income at the average salary.
A significant proportion of that inherited money will be spent on property and that additional spending power drives up prices, which, in turn, increases inheritances. For those families with property, it is a virtuous circle, but has the opposite effect for those who don’t. What we inherit, however, varies widely from the average, depending on where our parents live and what they earn. The offspring of the wealthiest families are likely to receive a 29% boost to their lifetime income via inheritances, whereas the least wealthy will get just a 5% boost, and those in the South of England tend to inherit around three-and-a-half times as much as those in the North East.
Inherited money has a particularly profound impact on first-time buyers. Rising property prices mean getting onto the housing ladder is becoming increasingly difficult. House prices are now nine times the average income; however, as renting is more expensive than buying, the biggest obstacle is saving for the deposit rather than the monthly payments. To get the best mortgage rates, a typical first-time buyer needs a deposit of 25%, or £63,500, which takes around 11 years to accumulate.
It is why inherited/intergenerational gifts can make such a big difference. Around 63% of first-time buyers get help in that way, but those 37% that don’t are likely to remain stuck in the rental sector, however hard they strive to get out of it. It is a scenario that is resulting in some worrying inequalities between the younger generations. It has implications for businesses, too, making it far harder for them to recruit staff for lower-paid jobs, with many potential workers forced to move away from the major cities in their search for affordable homes.
The lack of access to family money is now one of the key drivers of falling home ownership in the UK, why the average age of the first-time buyer is now 34 years old and 4.9 million people are still living with their parents. The Conservatives have constantly tinkered around the edges of the problem by variously reducing Stamp Duty for first-time buyers, introducing Help to Buy schemes and underwriting 95% mortgages. The only real solution though, and that includes almost all the housing industry’s problems, is to build more homes. The stumbling block has been the Conservatives’ fear of upsetting their core voters with a rash of new developments. Labour, on the other hand, have already said that they will ignore the NIMBYists and get building, even on some parts of the green belt.
We’ll see how that all pans out after the election.

Capital Gains
During the pandemic, the flight to the country - ‘The Race for Space’ - was never far from the headlines. It’s not surprising, at the time we were all either working remotely or had been furloughed. It meant we were spending almost all of our time in our homes and those homes, especially flats with no outside spaces, were beginning to feel somewhat claustrophobic. And, with the city’s bright lights dimmed and the commute a fading memory, there were few compelling reasons to stay. It led to significant numbers deciding they wanted to get away from the crowds and their cramped homes and move somewhere new, somewhere where there was more space and easier access to nature. According to Rightmove, at ‘The Race for Space’s’ peak in August 2021 as many as 46% of Londoners were considering abandoning the capital. The trend continued, even after the lockdowns had come to an end.
We may have all gone back to work, but many of us were still able to do so from home. The number of Londoners planning to remain in the capital for their next move is now back to the kinds of levels we used to see before the onset of the pandemic. The numbers looking to move out have now dropped from 46% to 32%. And, with the pressure to go back to the office growing by the day, that figure is likely to fall further. Transport for London stats show that commuter numbers have been increasing every year since their low point of 1.29bn journeys in 2020-21 and are predicted to reach 3.5bn in 2023-24. That is still, though, nearly 0.5bn below their pre-pandemic levels. As a result, there has been a positive start to the year in the capital’s housing market, especially when compared to the more subdued spring of 2023.
The number of homes for sale is up 11%, while the number of sales agreed has grown by 10%. Homes are also selling more quickly. The average number of days on the market is currently a day less at 63 than the national average of 64 days. Traditionally, it takes longer for homes to find buyers in the capital than in the rest of the country. Since 2017, London’s time-to-sell average has been faster than the national figure in only 6 out of 85 months.
London’s house prices rose by an impressive 1.4% last month bringing the average price to £696,120 - thats a rise of 2.8% on an annual basis. Some boroughs, though, have seen far larger rises than others. Some of the biggest are occurring in Westminster, whose market had been particularly badly hit by the pandemic, with average prices going up by 9.2% over the last year. Hammersmith and Fulham have also seen significant gains at 8.1%. Some of the more suburban areas, in contrast, have seen the biggest falls, such as Redbridge and Bexley (both down by 1.6%), Ealing (down 1.4%) and Harrow (down 1.2%). The return to the capital is also having a profound effect on rental prices. they started climbing sometime in advance of house prices, as the rental sector is more mobile and tends to react to changes far faster. London’s rental rises have already peaked back in September 2022, when they were going up by an astonishing 16.1% per annum. Although those meteoric rises have since slowed, rents still went up by 5.3% over the last year and demand remains so high that tenants are facing fierce competition to secure a new home, with an average of 9 people vying for each available property.
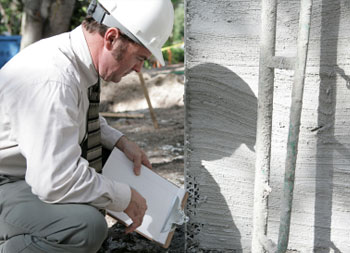
Are you Compliant?
Are you Compliant?
These days, making sure any work you do on your house is compliant with all the latest building regulations is getting more and more complicated. It’s not just for major construction projects, either, it even includes some very minor jobs, such as putting in a new shaver socket in the bathroom or installing a replacement front door. You may not even know you’ve contravened the rules until you try to sell your house, when the buyer’s solicitor, or surveyor, is likely to flag it up and that can sometimes lead to serious problems.
So, what do you need permission for, how do you get it and what happens if you don’t? The aims of the regulations are laudable - to ensure that any work carried out at your home is safe, energy-efficient and does not damage the local environment or your or your neighbours’ welfare. However, as with all these things there can sometimes be some bureaucratic overreach.
As you may already know, you will definitely need to get the work signed off if you are:
• Erecting a new building
• Extending or altering an existing building
• Forming a room in a loft conversion
• Changing the use of a building
• Underpinning a building
What you may not know is that the requirement for permission also normally includes:
• Putting in cavity wall insulation
• Re-covering a roof with different materials
• Creating a new opening for a door
• Removing part of a chimney stack or chimney breast
• Removing an internal load-bearing wall (not stud).
You may be even more surprised to discover it can also include:
• Installing replacement windows and roof lights
• Installing a new external door
• Installing a new bathroom, kitchen or toilet where none previously existed
• Putting new electrics in a bathroom
• Putting in a new boiler or heating system
• Installing a new toilet where none previously existed
These are not hard and fast rules, though, which means you should always check the details before commencing any work. The general principle is, though, that the only things that are not covered are very minor repair or replacement work. So, for instance, you can replace a broken plug socket, but you will need it signed off if you are installing a new one. If you are undertaking construction work, your builder should be able to guide you through the process. Building regulations come under the remit of your local authority’s Building Control Department but you can also hire a private approved inspector. Whichever you are using, you first need to submit a set of plans to be signed off. The inspector will then often make several site visits to ensure the work is being carried out correctly, after which they will issue a building regulations
completion certificate. There are, though, also a number of schemes that allow some of the trades to sign off their own work.
For windows and doors, they must be FENSA registered, electricians should be registered with organisations such as NICEIC, NAPIT, ECA, ELECSA and for gas, the contractor must be CORGI
registered to certify their own work. If you don’t get the work certified, you can apply for Retrospective Building Regulations Approval. To do this, you will need to get your local building control department to inspect the work. If they are satisfied it is up to standard, they will then issue you with a regularisation certificate. With this approach, though, there is the risk that the work will not comply and checking hidden aspects, such as foundations can prove tricky. If the work is non-compliant, you could be served with a section 36 notice, which will compel you to either bring the work up to standard or be removed or, in the case of an extension, pulled down. There are time limits, though. Local authorities can take enforcement action for any breaches of building control for twelve months after the work was completed with a Section 36 Notice. After that, they will have to take you to a magistrates court, which they can do for up to 10 years using a Section 35 or 35a Notice. The fines can be up to £5,000 per offence and you may also have to pay a daily fine. You can still be prosecuted after 10 years but that requires a high court injunction, which it is fairly rare.
If you are having problems with non-compliant work while you are selling your home, the simplest option is often to take out indemnity insurance. There is just a single premium to pay and it then covers the purchaser and mortgage lender against any financial losses if a Section 36 notice is served. However, it is essential that neither the buyer nor the seller informs the local authority of the breach, as it will invalidate the insurance.
Links:
Manual to the Building Regulations
https://assets.publishing.service.gov.uk/media/64

Elections & House Prices
At Homesite we like to keep you informed about everything that’s happening in the property market. Sometime towards the end of this year, there will be a general election and, no doubt, many of you will be wondering what effect this will have on house prices. We thought it would therefore be a good time to take a look at what happened during the last 8 elections, starting in April 1992, the year John Major won it for the Conservatives.
9th April 1992 - John Major (Conservatives). Avge. house price at the time - £55,166, which then rose 12% during their term in office.
In 1992 both the economy and property were in the middle of a major slump. In the run-up to the election, prices continued on their same downward path but then plummeted to a nadir of -7% in the following December before making a slow recovery over the next couple of years.
1st May 1997 - Tony Blair (Labour). Avge. price - £61,946. Then rose by 56%.
By May 1997, when Tony Blair was first elected as Prime Minister, house sales were already picking up. Prices had risen by 2.1% during the preceding 12 months. Just before the election, they slowed slightly, before taking off again, rising by as much as 5.1% in July and continuing on their upward trajectory until the next election.
7th June 2001 - Tony Blair (Labour). Avge. price - £96,499. Then rose by 61%.
Fast-forward to June 2001 - Blair was re-elected, sales were going strong and house prices were rising at an annual rate of 10%. In the months before the election, prices steadied before climbing immediately afterwards and then continued rising for several years, hitting their peak in the autumn of 2004.
5th May 2005 - Tony Blair/Gordon Brown (Labour) Avge. price - £155,533. Then rose by 10%.
Four years later, in May 2005, at the time of Blair’s third successive victory, prices were decelerating. Instead of the 20% plus rises seen in 2004, they had come down to 8.1%. In the months before and after the election, prices continued almost completely unaffected and transaction volumes actually increased. At the time people were going to the polls, the price of the average home had shot up to £155,533, an increase of over 61% since the previous election.
But then came the banking crisis of 2007/08, which provoked one of the deepest economic recessions in living memory. Bank lending dried up, the mortgage tap was turned off and, despite the base rate being slashed, the property market was thrust into five years of stagnation. The accompanying slump in house prices meant that by 2008, the cost of the average home had fallen by 16%.
6th May 2010 - David Cameron and Nick Clegg (Coalition). Avge. price - £170,846. Then rose by 14%.
By the time the next election came around, sales were moribund and prices had fallen from a pre-crash high of £190,032 (Sept 2007) to £170,846. That was, though, still 8.1% up from the previous year. In the two months prior to the election prices and sales volumes fell further before rising on the news that a coalition had been formed. It was, however, something of a false dawn, as sales were soon back in the doldrums.
It wasn’t until early 2013 that the government found a way of boosting the property market. The Funding for Lending Scheme injected billions of pounds of cheap taxpayers’ money into the banking system and most of it went on fresh mortgage lending.
7th May 2015 - David Cameron/Theresa May (Conservatives). Avge. price - £195,313. Then rose by 14%
The success of the Funding for Lending Scheme meant that by the 2015 election, house prices had reached £195,313. Growth tailed off slightly in the run-up to the election because, as in 2010, there was some uncertainty over the makeup of the next government. Once the result was known, the market picked up once again.
However, in June 2016, the UK voted to leave the EU, David Cameron resigned and Theresa May took over. After a brief pause for thought, house prices slowed rather than crashed, ending the year up 7.2% at £219,544.
8th June 2017 - Theresa May/Boris Johnson (Conservatives). Avge. price - £221,833. Then rose by 5%
Riding high in the polls and trying to push through her Brexit deal, Theresa May called an early election. As her polling worsened, house prices slowed sharply and then climbed immediately afterwards as her re-election gave some clarity of direction. However, the continuing fallout from the EU referendum and rising stamp duty costs meant any further rises were subdued, sales volumes plummeted and prices in London nose-dived.
Rows over the EU meant Theresa May didn’t last long, resigning as PM in May 2019 to be replaced by Boris Johnson. House prices had been sliding in the preceding months but then briefly returned to growth and just 7 months later there was yet another election.
12th December 2019 - Boris Johnson/Liz Truss/Rishi Sunak. Avge. price - £231,792
Long before the election was called, homeowners had been putting their plans on hold as they waited for the UK’s Brexit deal to be finalised. As a result, house prices were falling and sales volumes had dropped off the edge of a cliff. This process continued throughout the election period and then, with a deal finally signed at the end of January, there was the much-anticipated 'Boris Bounce'. But then COVID struck and we went into the first lockdown. House prices, however, boosted by Stamp Duty holidays, just kept on rising, hitting a high of £288,901 in September 2022.
The final lockdown ended in July 2021, but the boom carried on, only coming to a halt in February 2022, with the outbreak of war in Ukraine. The war brought about the cost-of-living crisis, raging inflation and soaring mortgage costs. By June of 2023, Boris had gone and just 44 days later, Liz Truss was gone, too, to be replaced by Rishi Sunak.
As we head into the next election, those financial headwinds are finally starting to recede, but only very slowly. However, the electorate appears unwilling to forgive the Tories for either the political or financial turmoil of the last few years and most would now put their money on a Labour victory in the autumn.
Current Avge. price (Feb 20224) - £280,660, a rise of 21%
So what can we deduce from this quick trip through history?
It is quite clear that the market is far more affected by the prevailing economic conditions rather than elections. However, any uncertainty over the nature of an incoming government will produce brief distortions in the market, normally around 6 weeks beforehand, after which activity and prices swiftly return to where they were pre-election.
It is encouraging to note that, however well or badly they did, in the last 32 years, every single government oversaw rises in the value of our homes during their term of office, suggesting that prices rise in spite of politics and politicians. And, even though the Conservative Party has a reputation for boosting the housing market, Labour has a far better track record, which should give some comfort to any homeowners nervous about the arrival of Keir Starmer and Co.

What does the average buyer in Notting Hill want?
What does the average buyer in Notting Hill want? A doer-upper or a ready-to-move-into home?
Which is more desirable to them - a doer-upper with potential or somewhere that’s immaculately presented and ready to move into?
Do they really want to roll up their sleeves and get stuck in? Can they actually see beyond the dated kitchens and the mouldy bathrooms, the peeling wallpaper and the care-worn carpets?
Surely most people just want to collect the keys to a sparkling new home with perfect paintwork, brand new carpets and a designer kitchen that’s full of the latest gadgets? Somewhere where all they need to do, once they move in, is to make themselves at home?
Rightmove has the data that can answer all these questions and more. They looked at 6000,0000 listings and analysed which of their features generated the most enquiries.
So, what did they find?
When they had compiled all the data, they found that both were true.
Buyers are just people and they are all different. One size will never fit us all.
Currently, however, the number one feature is a ‘Renovation Project’ - a fixer-upper in need of a refurb.
There are a number of reasons why that is the case. There will always be plenty of buyers who are looking for somewhere where they can add value through hard work and a little imagination. But, with the cost-of-living crisis and a base rate of 5.25%, finances are tight and it’s not just first-time buyers who can’t always afford what they want (or need). More and more of us are now having to make compromises.
Doer-uppers are nearly 10% cheaper than the average home. At the time of the survey, that represented typical savings of around £29,000.
Better still, a doer-upper doesn’t all have to be done at once. It can be worked on in stages, whenever any additional money becomes available. We do, though, prefer a property that requires the kind of refurbishment that we can do ourselves rather than having to call in the professionals.
‘Refurbished’ does still makes the top 10, but at a relatively lowly number 7. And, as you might expect, refurbished homes come at a premium. Typically, that's around 19% or £70,000 more than the average home or nearly £100,000 more than a doer-upper, so you’ll have to really like the way it has been done.
Rightmove’s property expert Tim Bannister says:
“This really shows the different priorities that home-movers have – some are in a more fortunate position to be able to consider buying a newly refurbished home, while others want to put their own stamp on a home and do it up from scratch, or they may realise that if they buy now they can spend time doing up the house a room at a time.”
Something else the survey uncovered was how strong our desire is for extra living and storage space. At number 3 was - ‘Loft Conversion’, at number 4 was - ‘Storage Space’, and “Cellar’ was at number 5.
Energy efficiency was another popular theme, with two spots in the top ten – ‘New Boiler’ was at a lofty number 2 and ‘Double Glazing’ at number 6.
The convenience of being ‘Chain Free” was at number 8. And, it seems, the race for space is not entirely over because ‘Garden’ was at number 9.
Last but not least was the requirement that a new home should be ‘Near a Station’ rather than having a parking space.
So, now you know - when you are buying and selling a home, it's all about individual choices.

English Housing Survey
Every year, the Government produces the English Housing Survey, which takes a look at how and where we are living today. If you are thinking of investing in the housing market, as many of our customers at Homesite are, it will provide you with some valuable insights.
So, where do we live?
The vast majority of the UK’s households are owner-occupiers (65%), 19% are housed in privately rented accommodation and the remaining 16% are social renters. With the cost of buying a house in London far higher, there were considerably fewer owner-occupiers (49%) and far more private renters (31%) in the capital. Shockingly, across the UK, there were 1.1 million vacant homes.
Home ownership has been falling for some time, the number of private renters has been rising and social rental numbers have nosedived. From its all-time high in 2003, the proportion of owner-occupiers has come down from 71% to 65%. The number of households in the private rented sector (PRS), on the other hand, has nearly doubled. In the ‘80s and ‘90s, between 9% and 11% of households were in the PRS. That figure now hovers between 19% and 20%. At the same time, the social rented sector has sunk to its lowest ever level (16%). It’s local authority housing that has fallen the most, currently providing accommodation for just 6% of households, with housing associations taking up the slack at 10%.
Unsurprisingly, it's the young who dominate the private rental sector and the old who form the majority of owner-occupiers. The number of social renters, however, is consistent across all the age groups, suggesting that the sector tends to be very static, with few people moving on once they are in it.
What kind of homes do we live in?
It’s private sector renters who tend to live in the oldest buildings rather than owner-occupiers, with 31% of their homes built before 1919. For owner-occupiers, the figure was 20% and 7% for public sector tenants. As you might expect, a large percentage of public sector housing is comprised of tower blocks and a significant proportion of private rented stock is in converted houses.
When it comes to the size of our properties, the average usable floor space was 97m2. Social rented homes tended to be smaller at 67m2, private rented homes were 76m2, and owner-occupied homes were the largest at 111m2.
There is no doubt rising energy costs are having a serious effect on all our homes, driving improvements in energy efficiency. Over the last 10 years, the proportion of homes in the highest energy efficiency bands (A to C) increased from 19% to 48%. Homes in the social rented sector saw an even bigger rise, going from 36% to 70%.
And they are in better all-round condition, too. Between 2019 and 2022, the number of non-decent owner-occupied homes fell from 16% to 14% and from 12% down to 10 % for social rented ones. Damp problems, though, are on the increase. Pre-pandemic, 3% of housing stock had a problem with damp, but that figure is now 4%. It’s even more of a problem in the PRS, where the percentage rose from 7% to 9% over the same period.
How are we paying for it all?
Half of all the principal householders were working full-time, 10% were working part-time and 29% were retired. Roughly 2% of households were unemployed, 1% were in full-time education and 7% were ‘other inactive’, which includes anyone with a long-term illness or disability and those looking after the family or home. Owner occupiers tend to have the highest income, social renters the lowest and private renters’ income had a far more even spread.
The cost-of-living crisis and the rising base rate have been putting a lot of pressure on finances. More than a quarter of private renters were reporting difficulties paying their rent (29%), social renters were at similar levels at 27% and 11% of owner-occupiers were having difficulties paying their mortgages.
It has also made it far harder to get on the housing ladder – 36% needed help from family or friends to pay for the deposit, which was a significant increase from the 27% in the previous year.
And are we happy where we are?
According to the statistics, home ownership really is the route to happiness. Owner occupiers are not only the most satisfied with their lot (78%), they are also most convinced that life is worthwhile (80%), the happiest (77%) and the least anxious (28%). Social renters are the least happy (69%) and the most stressed (36%). Private renters are slap-bang in the middle.
Market update
At Homesite we like to keep you up to date with everything that’s been happening in the property market. And, the good news is, as spring arrives, it continues to return to life. Rightmove reports that asking prices were up 0.9% in February and, after several months of rises, most of the major indices are now showing annual growth has moved into positive territory. Activity levels are on the increase, too, with the number of agreed sales up by 16% compared to the same period last year and by 3% compared to the more normal 2019. At the same time, buyer choice is also improving, with a 7% rise in new listings on Rightmove.
Tim Bannister Rightmove’s Director of Property Science says:
“We said that February would be an important indicator for the year ahead, and the question was whether the Rightmove Boxing Day bounce in buyer activity would keep its spring into March or lose momentum. It’s proved to be the former, with the number of sales agreed continuing to considerably outstrip last year. Early-bird Boxing Day buyers got a head start in cherry picking from a record level of new property choice and have now been joined by many other buyers also believing that 2024 offers the right market conditions to move.”
The drivers of all this increased activity are clear – buyers’ confidence is rising on the back of mortgage cost falls. However, mortgage rates are still some way above recent averages and there is uncertainty over when and how much they will come down. It means buyers remain cautious and some are waiting for the base rate to start falling before making a move. This more cautious approach means property is taking over two weeks longer (16 days) to find a buyer. At an average of 78 days, it’s at its slowest since 2015 and anything overpriced is struggling to find any buyers at all. In London, the average is even higher at 84 days.
First-time buyers (FTBs) are finding the conditions the hardest and, despite the soaring costs of rents, higher mortgage rates mean it is currently considerably more expensive to buy than rent for the average FTB. However, with an election looming, the government may be keen to give them a boost and it would be no surprise if they launched some sort of first-time buyer scheme in the coming months.
HOUSE PRICES AND STATISTICS
Of all the most up-to-date indices, only Zoopla’s annual price remains in negative territory and that is probably because it is running a month behind the others.
Nationwide: Feb: Avge. price £260,420. Monthly change +0.7%. Annual change +1.2%
Halifax: Feb. Avge. price £291,699. Monthly change +0.4%. Annual change +1.7%
Land Registry: Dec: Avge. price £284,691. Monthly change +0.1%. Annual change -1.4%
Zoopla: Jan: Avge. price £263,600. Annual change -0.5%
Rightmove: Feb: Avge. price £362,839. Monthly change +0.9%. Annual change +0.1% (asking prices on Rightmove)
BUY-TO-LET
Just as the housing market is warming up, so the rental market is continuing to cool down. Although the average rent was up by 0.2% to £1,262pcm last month, stretched affordability meant rents fell in 4 out of the 12 regions. And, as has been the case for some time now, they came down most in London, where they dropped by 0.5% to £2,070pcm. On an annual basis, the Capital’s rents were still up by 4.8% but that is compared to 7.4% across the UK and that figure has been coming down for several months. It is, though, a very mixed picture, with some London boroughs seeing falls rather than gains. Camden’s rents, for example, were down by 3.6% and Tower Hamlet’s by 1.8%. In contrast, Barking, Dagenham and Havering’s were up by 11.8% (source: Homelet Rental Index)
Despite the softening of rents, the supply of rental property remains challenging. There have been some minor improvements, but tenants are still having to compete for any available properties. Michael Gove is hoping that by removing the tax breaks from short holiday lets, some landlords may opt to put their properties onto the standard lettings market, but that remains to be seen and the numbers are not likely to be significant.