Are you Compliant?
Are you Compliant?
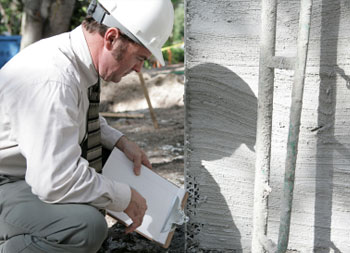
These days, making sure any work you do on your house is compliant with all the latest building regulations is getting more and more complicated. It’s not just for major construction projects, either, it even includes some very minor jobs, such as putting in a new shaver socket in the bathroom or installing a replacement front door. You may not even know you’ve contravened the rules until you try to sell your house, when the buyer’s solicitor, or surveyor, is likely to flag it up and that can sometimes lead to serious problems.
So, what do you need permission for, how do you get it and what happens if you don’t? The aims of the regulations are laudable - to ensure that any work carried out at your home is safe, energy-efficient and does not damage the local environment or your or your neighbours’ welfare. However, as with all these things there can sometimes be some bureaucratic overreach.
As you may already know, you will definitely need to get the work signed off if you are:
• Erecting a new building
• Extending or altering an existing building
• Forming a room in a loft conversion
• Changing the use of a building
• Underpinning a building
What you may not know is that the requirement for permission also normally includes:
• Putting in cavity wall insulation
• Re-covering a roof with different materials
• Creating a new opening for a door
• Removing part of a chimney stack or chimney breast
• Removing an internal load-bearing wall (not stud).
You may be even more surprised to discover it can also include:
• Installing replacement windows and roof lights
• Installing a new external door
• Installing a new bathroom, kitchen or toilet where none previously existed
• Putting new electrics in a bathroom
• Putting in a new boiler or heating system
• Installing a new toilet where none previously existed
These are not hard and fast rules, though, which means you should always check the details before commencing any work. The general principle is, though, that the only things that are not covered are very minor repair or replacement work. So, for instance, you can replace a broken plug socket, but you will need it signed off if you are installing a new one. If you are undertaking construction work, your builder should be able to guide you through the process. Building regulations come under the remit of your local authority’s Building Control Department but you can also hire a private approved inspector. Whichever you are using, you first need to submit a set of plans to be signed off. The inspector will then often make several site visits to ensure the work is being carried out correctly, after which they will issue a building regulations
completion certificate. There are, though, also a number of schemes that allow some of the trades to sign off their own work.
For windows and doors, they must be FENSA registered, electricians should be registered with organisations such as NICEIC, NAPIT, ECA, ELECSA and for gas, the contractor must be CORGI
registered to certify their own work. If you don’t get the work certified, you can apply for Retrospective Building Regulations Approval. To do this, you will need to get your local building control department to inspect the work. If they are satisfied it is up to standard, they will then issue you with a regularisation certificate. With this approach, though, there is the risk that the work will not comply and checking hidden aspects, such as foundations can prove tricky. If the work is non-compliant, you could be served with a section 36 notice, which will compel you to either bring the work up to standard or be removed or, in the case of an extension, pulled down. There are time limits, though. Local authorities can take enforcement action for any breaches of building control for twelve months after the work was completed with a Section 36 Notice. After that, they will have to take you to a magistrates court, which they can do for up to 10 years using a Section 35 or 35a Notice. The fines can be up to £5,000 per offence and you may also have to pay a daily fine. You can still be prosecuted after 10 years but that requires a high court injunction, which it is fairly rare.
If you are having problems with non-compliant work while you are selling your home, the simplest option is often to take out indemnity insurance. There is just a single premium to pay and it then covers the purchaser and mortgage lender against any financial losses if a Section 36 notice is served. However, it is essential that neither the buyer nor the seller informs the local authority of the breach, as it will invalidate the insurance.
Links:
Manual to the Building Regulations
https://assets.publishing.service.gov.uk/media/64

Elections & House Prices
At Homesite we like to keep you informed about everything that’s happening in the property market. Sometime towards the end of this year, there will be a general election and, no doubt, many of you will be wondering what effect this will have on house prices. We thought it would therefore be a good time to take a look at what happened during the last 8 elections, starting in April 1992, the year John Major won it for the Conservatives.
9th April 1992 - John Major (Conservatives). Avge. house price at the time - £55,166, which then rose 12% during their term in office.
In 1992 both the economy and property were in the middle of a major slump. In the run-up to the election, prices continued on their same downward path but then plummeted to a nadir of -7% in the following December before making a slow recovery over the next couple of years.
1st May 1997 - Tony Blair (Labour). Avge. price - £61,946. Then rose by 56%.
By May 1997, when Tony Blair was first elected as Prime Minister, house sales were already picking up. Prices had risen by 2.1% during the preceding 12 months. Just before the election, they slowed slightly, before taking off again, rising by as much as 5.1% in July and continuing on their upward trajectory until the next election.
7th June 2001 - Tony Blair (Labour). Avge. price - £96,499. Then rose by 61%.
Fast-forward to June 2001 - Blair was re-elected, sales were going strong and house prices were rising at an annual rate of 10%. In the months before the election, prices steadied before climbing immediately afterwards and then continued rising for several years, hitting their peak in the autumn of 2004.
5th May 2005 - Tony Blair/Gordon Brown (Labour) Avge. price - £155,533. Then rose by 10%.
Four years later, in May 2005, at the time of Blair’s third successive victory, prices were decelerating. Instead of the 20% plus rises seen in 2004, they had come down to 8.1%. In the months before and after the election, prices continued almost completely unaffected and transaction volumes actually increased. At the time people were going to the polls, the price of the average home had shot up to £155,533, an increase of over 61% since the previous election.
But then came the banking crisis of 2007/08, which provoked one of the deepest economic recessions in living memory. Bank lending dried up, the mortgage tap was turned off and, despite the base rate being slashed, the property market was thrust into five years of stagnation. The accompanying slump in house prices meant that by 2008, the cost of the average home had fallen by 16%.
6th May 2010 - David Cameron and Nick Clegg (Coalition). Avge. price - £170,846. Then rose by 14%.
By the time the next election came around, sales were moribund and prices had fallen from a pre-crash high of £190,032 (Sept 2007) to £170,846. That was, though, still 8.1% up from the previous year. In the two months prior to the election prices and sales volumes fell further before rising on the news that a coalition had been formed. It was, however, something of a false dawn, as sales were soon back in the doldrums.
It wasn’t until early 2013 that the government found a way of boosting the property market. The Funding for Lending Scheme injected billions of pounds of cheap taxpayers’ money into the banking system and most of it went on fresh mortgage lending.
7th May 2015 - David Cameron/Theresa May (Conservatives). Avge. price - £195,313. Then rose by 14%
The success of the Funding for Lending Scheme meant that by the 2015 election, house prices had reached £195,313. Growth tailed off slightly in the run-up to the election because, as in 2010, there was some uncertainty over the makeup of the next government. Once the result was known, the market picked up once again.
However, in June 2016, the UK voted to leave the EU, David Cameron resigned and Theresa May took over. After a brief pause for thought, house prices slowed rather than crashed, ending the year up 7.2% at £219,544.
8th June 2017 - Theresa May/Boris Johnson (Conservatives). Avge. price - £221,833. Then rose by 5%
Riding high in the polls and trying to push through her Brexit deal, Theresa May called an early election. As her polling worsened, house prices slowed sharply and then climbed immediately afterwards as her re-election gave some clarity of direction. However, the continuing fallout from the EU referendum and rising stamp duty costs meant any further rises were subdued, sales volumes plummeted and prices in London nose-dived.
Rows over the EU meant Theresa May didn’t last long, resigning as PM in May 2019 to be replaced by Boris Johnson. House prices had been sliding in the preceding months but then briefly returned to growth and just 7 months later there was yet another election.
12th December 2019 - Boris Johnson/Liz Truss/Rishi Sunak. Avge. price - £231,792
Long before the election was called, homeowners had been putting their plans on hold as they waited for the UK’s Brexit deal to be finalised. As a result, house prices were falling and sales volumes had dropped off the edge of a cliff. This process continued throughout the election period and then, with a deal finally signed at the end of January, there was the much-anticipated 'Boris Bounce'. But then COVID struck and we went into the first lockdown. House prices, however, boosted by Stamp Duty holidays, just kept on rising, hitting a high of £288,901 in September 2022.
The final lockdown ended in July 2021, but the boom carried on, only coming to a halt in February 2022, with the outbreak of war in Ukraine. The war brought about the cost-of-living crisis, raging inflation and soaring mortgage costs. By June of 2023, Boris had gone and just 44 days later, Liz Truss was gone, too, to be replaced by Rishi Sunak.
As we head into the next election, those financial headwinds are finally starting to recede, but only very slowly. However, the electorate appears unwilling to forgive the Tories for either the political or financial turmoil of the last few years and most would now put their money on a Labour victory in the autumn.
Current Avge. price (Feb 20224) - £280,660, a rise of 21%
So what can we deduce from this quick trip through history?
It is quite clear that the market is far more affected by the prevailing economic conditions rather than elections. However, any uncertainty over the nature of an incoming government will produce brief distortions in the market, normally around 6 weeks beforehand, after which activity and prices swiftly return to where they were pre-election.
It is encouraging to note that, however well or badly they did, in the last 32 years, every single government oversaw rises in the value of our homes during their term of office, suggesting that prices rise in spite of politics and politicians. And, even though the Conservative Party has a reputation for boosting the housing market, Labour has a far better track record, which should give some comfort to any homeowners nervous about the arrival of Keir Starmer and Co.

What does the average buyer in Notting Hill want?
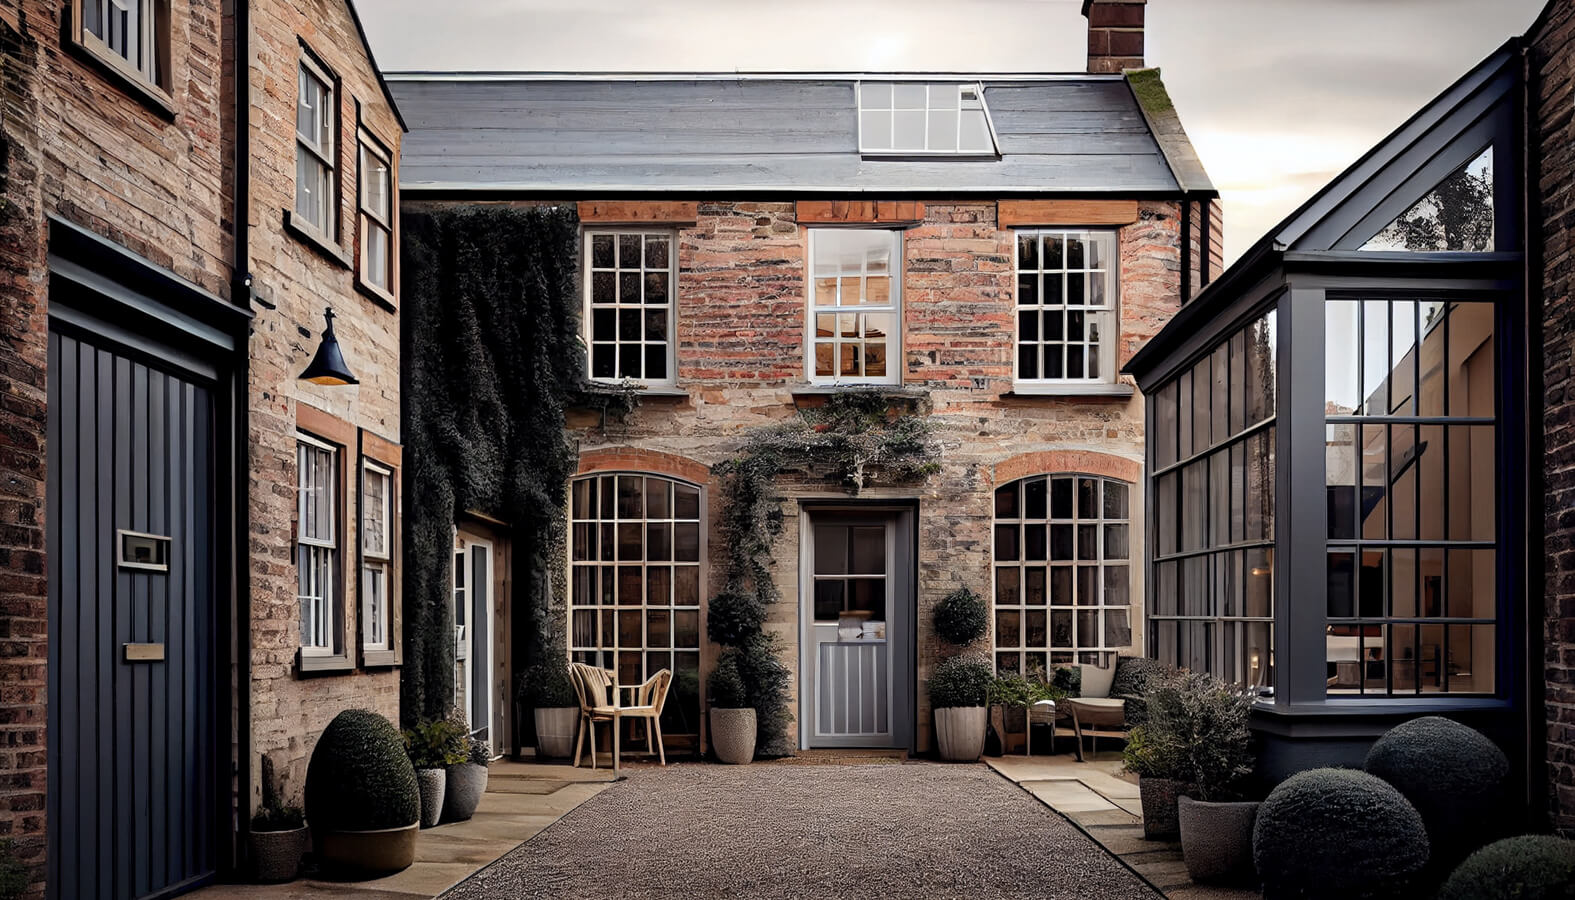
What does the average buyer in Notting Hill want? A doer-upper or a ready-to-move-into home?
Which is more desirable to them - a doer-upper with potential or somewhere that’s immaculately presented and ready to move into?
Do they really want to roll up their sleeves and get stuck in? Can they actually see beyond the dated kitchens and the mouldy bathrooms, the peeling wallpaper and the care-worn carpets?
Surely most people just want to collect the keys to a sparkling new home with perfect paintwork, brand new carpets and a designer kitchen that’s full of the latest gadgets? Somewhere where all they need to do, once they move in, is to make themselves at home?
Rightmove has the data that can answer all these questions and more. They looked at 6000,0000 listings and analysed which of their features generated the most enquiries.
So, what did they find?
When they had compiled all the data, they found that both were true.
Buyers are just people and they are all different. One size will never fit us all.
Currently, however, the number one feature is a ‘Renovation Project’ - a fixer-upper in need of a refurb.
There are a number of reasons why that is the case. There will always be plenty of buyers who are looking for somewhere where they can add value through hard work and a little imagination. But, with the cost-of-living crisis and a base rate of 5.25%, finances are tight and it’s not just first-time buyers who can’t always afford what they want (or need). More and more of us are now having to make compromises.
Doer-uppers are nearly 10% cheaper than the average home. At the time of the survey, that represented typical savings of around £29,000.
Better still, a doer-upper doesn’t all have to be done at once. It can be worked on in stages, whenever any additional money becomes available. We do, though, prefer a property that requires the kind of refurbishment that we can do ourselves rather than having to call in the professionals.
‘Refurbished’ does still makes the top 10, but at a relatively lowly number 7. And, as you might expect, refurbished homes come at a premium. Typically, that's around 19% or £70,000 more than the average home or nearly £100,000 more than a doer-upper, so you’ll have to really like the way it has been done.
Rightmove’s property expert Tim Bannister says:
“This really shows the different priorities that home-movers have – some are in a more fortunate position to be able to consider buying a newly refurbished home, while others want to put their own stamp on a home and do it up from scratch, or they may realise that if they buy now they can spend time doing up the house a room at a time.”
Something else the survey uncovered was how strong our desire is for extra living and storage space. At number 3 was - ‘Loft Conversion’, at number 4 was - ‘Storage Space’, and “Cellar’ was at number 5.
Energy efficiency was another popular theme, with two spots in the top ten – ‘New Boiler’ was at a lofty number 2 and ‘Double Glazing’ at number 6.
The convenience of being ‘Chain Free” was at number 8. And, it seems, the race for space is not entirely over because ‘Garden’ was at number 9.
Last but not least was the requirement that a new home should be ‘Near a Station’ rather than having a parking space.
So, now you know - when you are buying and selling a home, it's all about individual choices.

English Housing Survey
Every year, the Government produces the English Housing Survey, which takes a look at how and where we are living today. If you are thinking of investing in the housing market, as many of our customers at Homesite are, it will provide you with some valuable insights.
So, where do we live?
The vast majority of the UK’s households are owner-occupiers (65%), 19% are housed in privately rented accommodation and the remaining 16% are social renters. With the cost of buying a house in London far higher, there were considerably fewer owner-occupiers (49%) and far more private renters (31%) in the capital. Shockingly, across the UK, there were 1.1 million vacant homes.
Home ownership has been falling for some time, the number of private renters has been rising and social rental numbers have nosedived. From its all-time high in 2003, the proportion of owner-occupiers has come down from 71% to 65%. The number of households in the private rented sector (PRS), on the other hand, has nearly doubled. In the ‘80s and ‘90s, between 9% and 11% of households were in the PRS. That figure now hovers between 19% and 20%. At the same time, the social rented sector has sunk to its lowest ever level (16%). It’s local authority housing that has fallen the most, currently providing accommodation for just 6% of households, with housing associations taking up the slack at 10%.
Unsurprisingly, it's the young who dominate the private rental sector and the old who form the majority of owner-occupiers. The number of social renters, however, is consistent across all the age groups, suggesting that the sector tends to be very static, with few people moving on once they are in it.
What kind of homes do we live in?
It’s private sector renters who tend to live in the oldest buildings rather than owner-occupiers, with 31% of their homes built before 1919. For owner-occupiers, the figure was 20% and 7% for public sector tenants. As you might expect, a large percentage of public sector housing is comprised of tower blocks and a significant proportion of private rented stock is in converted houses.
When it comes to the size of our properties, the average usable floor space was 97m2. Social rented homes tended to be smaller at 67m2, private rented homes were 76m2, and owner-occupied homes were the largest at 111m2.
There is no doubt rising energy costs are having a serious effect on all our homes, driving improvements in energy efficiency. Over the last 10 years, the proportion of homes in the highest energy efficiency bands (A to C) increased from 19% to 48%. Homes in the social rented sector saw an even bigger rise, going from 36% to 70%.
And they are in better all-round condition, too. Between 2019 and 2022, the number of non-decent owner-occupied homes fell from 16% to 14% and from 12% down to 10 % for social rented ones. Damp problems, though, are on the increase. Pre-pandemic, 3% of housing stock had a problem with damp, but that figure is now 4%. It’s even more of a problem in the PRS, where the percentage rose from 7% to 9% over the same period.
How are we paying for it all?
Half of all the principal householders were working full-time, 10% were working part-time and 29% were retired. Roughly 2% of households were unemployed, 1% were in full-time education and 7% were ‘other inactive’, which includes anyone with a long-term illness or disability and those looking after the family or home. Owner occupiers tend to have the highest income, social renters the lowest and private renters’ income had a far more even spread.
The cost-of-living crisis and the rising base rate have been putting a lot of pressure on finances. More than a quarter of private renters were reporting difficulties paying their rent (29%), social renters were at similar levels at 27% and 11% of owner-occupiers were having difficulties paying their mortgages.
It has also made it far harder to get on the housing ladder – 36% needed help from family or friends to pay for the deposit, which was a significant increase from the 27% in the previous year.
And are we happy where we are?
According to the statistics, home ownership really is the route to happiness. Owner occupiers are not only the most satisfied with their lot (78%), they are also most convinced that life is worthwhile (80%), the happiest (77%) and the least anxious (28%). Social renters are the least happy (69%) and the most stressed (36%). Private renters are slap-bang in the middle.

Market update
At Homesite we like to keep you up to date with everything that’s been happening in the property market. And, the good news is, as spring arrives, it continues to return to life. Rightmove reports that asking prices were up 0.9% in February and, after several months of rises, most of the major indices are now showing annual growth has moved into positive territory. Activity levels are on the increase, too, with the number of agreed sales up by 16% compared to the same period last year and by 3% compared to the more normal 2019. At the same time, buyer choice is also improving, with a 7% rise in new listings on Rightmove.
Tim Bannister Rightmove’s Director of Property Science says:
“We said that February would be an important indicator for the year ahead, and the question was whether the Rightmove Boxing Day bounce in buyer activity would keep its spring into March or lose momentum. It’s proved to be the former, with the number of sales agreed continuing to considerably outstrip last year. Early-bird Boxing Day buyers got a head start in cherry picking from a record level of new property choice and have now been joined by many other buyers also believing that 2024 offers the right market conditions to move.”
The drivers of all this increased activity are clear – buyers’ confidence is rising on the back of mortgage cost falls. However, mortgage rates are still some way above recent averages and there is uncertainty over when and how much they will come down. It means buyers remain cautious and some are waiting for the base rate to start falling before making a move. This more cautious approach means property is taking over two weeks longer (16 days) to find a buyer. At an average of 78 days, it’s at its slowest since 2015 and anything overpriced is struggling to find any buyers at all. In London, the average is even higher at 84 days.
First-time buyers (FTBs) are finding the conditions the hardest and, despite the soaring costs of rents, higher mortgage rates mean it is currently considerably more expensive to buy than rent for the average FTB. However, with an election looming, the government may be keen to give them a boost and it would be no surprise if they launched some sort of first-time buyer scheme in the coming months.
HOUSE PRICES AND STATISTICS
Of all the most up-to-date indices, only Zoopla’s annual price remains in negative territory and that is probably because it is running a month behind the others.
Nationwide: Feb: Avge. price £260,420. Monthly change +0.7%. Annual change +1.2%
Halifax: Feb. Avge. price £291,699. Monthly change +0.4%. Annual change +1.7%
Land Registry: Dec: Avge. price £284,691. Monthly change +0.1%. Annual change -1.4%
Zoopla: Jan: Avge. price £263,600. Annual change -0.5%
Rightmove: Feb: Avge. price £362,839. Monthly change +0.9%. Annual change +0.1% (asking prices on Rightmove)
BUY-TO-LET
Just as the housing market is warming up, so the rental market is continuing to cool down. Although the average rent was up by 0.2% to £1,262pcm last month, stretched affordability meant rents fell in 4 out of the 12 regions. And, as has been the case for some time now, they came down most in London, where they dropped by 0.5% to £2,070pcm. On an annual basis, the Capital’s rents were still up by 4.8% but that is compared to 7.4% across the UK and that figure has been coming down for several months. It is, though, a very mixed picture, with some London boroughs seeing falls rather than gains. Camden’s rents, for example, were down by 3.6% and Tower Hamlet’s by 1.8%. In contrast, Barking, Dagenham and Havering’s were up by 11.8% (source: Homelet Rental Index)
Despite the softening of rents, the supply of rental property remains challenging. There have been some minor improvements, but tenants are still having to compete for any available properties. Michael Gove is hoping that by removing the tax breaks from short holiday lets, some landlords may opt to put their properties onto the standard lettings market, but that remains to be seen and the numbers are not likely to be significant.

How quickly will my house sell in Notting Hill?
It's a common enough question, but unfortunately, it's one that doesn't always have easy answers.
To get a truly accurate picture of how long the process will take, you would need average figures for every single variable. Clearly, that wouldn't be practical. However, thanks to Rightmove, there is a guide to average times across the UK.
AVERAGE TIME ON THE MARKET 2023
• January – 62 days (national) 74 (London)
• Mar – 55 days (national) 65 (London)
• July - 55 days (national) 61 (London)
THE EFFECT OF THE RISING BASE RATE
With the base rate and mortgage costs rising, affordability is getting stretched. As a result, the housing market is seeing a shift in dynamics, with buyers behaving more cautiously and a significant number waiting for the base rate to come down before making a move.
Tim Bannister, Rightmove's Director of Property Science, notes:
"Our analysis shows that homes that are priced right the first time, rather than priced too high only to be reduced later, are not only more likely to find a buyer but more likely to find a buyer quickly. This supports local agent reports of a two-speed market, with some properties for sale being overpriced and at risk of going stale, and many competitively priced homes which are attracting multiple prospective buyers."
There are plenty of regional variations. In London, sales are taking 11% longer than average at 61 days. In Scotland, sales are running far faster at just 31 days, and in the North East, they are taking 49 days.
These figures do not take into account the time taken between exchange and completion, which typically adds another 2 weeks. It is also worth bearing in mind that with property sales, you can encounter the odd complication, such as a disappointing survey or a particularly long chain. The amount of time they add to the sales process is normally directly related to their complexity.
To put this into context, it's worth having a quick look at it from a buyer's perspective. The average buying cycle takes almost twice as long as the sales one.
THE AVERAGE BUYING TIMES
• Beginning of the search to offer accepted: 12 weeks
• Obtaining a mortgage offer: + 6 weeks
• Conveyancing: 8 to 10 weeks
• Exchange of contracts: 2 to 3 weeks
• Completion: + 2 weeks
• Total: 31 weeks (217 days)

Have mortgage rates peaked?
Inflation has slowed for 3 months in a row. August’s figures were expected to show a slight uptick as a result of rising fuel prices but, instead, there was a fall of 0.1% to 6.7% and many experts believe we are over the worst. And, it seems, that now includes the Bank of England, who have announced the base rate is to remain at 5.25%, ending a run of 14 consecutive rises.
Mortgage rates were already coming down and it remains to be seen whether the news will bring further reductions. It’s the cost of the longer-term 5-year fixed-rate mortgages that have seen the biggest falls. Some of the best deals are down by as much as 0.4% and one or two have dropped below 5%. The base rate, on the other hand, is expected to remain at 5.25% for some time before it starts coming down.
Falling finance costs should help shore up the housing market. However, as there are still large numbers of borrowers on fixed-rate deals who have yet to feel the full impact of the rising base rate, sales are unlikely to take off again in the near term. Next year, 1.6 million people will be coming to the end of their deals.
Those with five-year fixes will have been used to rates of between 1.5% and 2%. At current levels, they will see their mortgage payments shoot up by between 250% to 350%. And, as late as spring last year, the best deals were still around 2%, so it will be a shock for those on two and three-year fixes, too.
Below is a selection of this month’s best buys from Moneyfacts.co.uk:
Two-year fixed rates: 5.70% from first direct. Product fee £490. 75% LTV.
5.70% from Nationwide. Product fee £0. 60% LTV.
Three-year fixed rates: 5.62% from first direct. Product fee £490. 75% LTV.
5.74% from Nationwide BS. Product fee £999. 60% LTV.
Five-year fixed rates: 5.08% from first direct. Product fee £490. 75% LTV.
5.14% from first direct. Product fee £0. 75% LTV.
Discounted variable: 5.24% For 2 years. From Harpenden BS. Product fee £800. 65% LTV.
5.29% For 2 years. From Beverley BS. Product fee £1,495. 65% LTV.
BUY-TO-LET (BTL)
Best two-year fixed rate: 4.89% from The Mortgage Works. Arrangement 3.00% Advance. 65% LTV.
Five-year fixed rate: 5.04% from The Mortgage Works. Arrangement 3.00% Advance. 65% LTV
Best Discounted variable: 5.20% For 2 years. From Monmouthshire BS. Arrangement 2.00% Advance. 75% LTV.

What effect is the rising base rate having on house prices?
As you know, at Homesite, we like to keep you up to date with all the latest news. It is rising mortgages and the base rate that have been the grabbing the headlines over the last six months. So, after last month’s better than expected figures, the markets were watching very closely to see whether inflation was finally on the retreat.
The latest data has now been released and, it seems, last month was no one-off, as headline inflation has dropped once again, down from 7.9% to 6.8%. If the trend continues next month, it could mark a turning point for the UK’s economy. That would be especially good news for the housing market as continually rising mortgage costs and the uncertainty over how high they might go has steadily chipped away at both prices and buyer confidence. There are still likely to be one or two more rises to come (see finances) but the base rate should peak earlier and some way below the 6.5% that had been forecast.
Despite it all, house prices are continuing to prove remarkably resilient. Halifax, Nationwide and Rightmove are all reporting falls in July but only between 0.2% and 0.3% in what is normally a flat month.
As Kim Kinnaird, Director, Halifax Mortgages, says:
“In reality, prices are little changed over the last six months, with the typical property now costing £285,044, compared to £285,660 in February. The pace of annual decline also slowed to -2.4% in July, versus -2.6% in June. These figures add to the sense of a housing market which continues to display a degree of resilience in the face of tough economic headwinds.”
According to the main indices, the area most affected by the rising base rate is sales volumes. Nationwide reports, in June, that they were 10% below pre-pandemic levels (2019) and the most up-to-date figures, Rightmove’s, show, in July, sales volumes were down by 12%. At the same time, there was a shortage in the supply of new properties coming up for sale, whose numbers were also down by 12%, which helped support prices.
It’s the top two tiers of the housing market – second-stepper and the top-of-the-ladder homes - that saw the biggest falls in sales volumes - down 14% on 2019 levels.
Surprisingly, it’s first-time buyer sales that are holding up the best, with many searching for smaller homes in order to offset their higher borrowing costs. As a result, sales volumes in the FTB sector had the smallest falls at 9%.
Looking ahead, it may be a while before the new, more positive inflationary data has any discernible effect on sales and prices, especially as more hesitant buyers will want to see inflation falling for a third month before making a move. After that, how the market responds will depend on how quickly and how far mortgage rates fall. Most commentators, however, are not expecting mortgages to come down significantly over the next 18 months, so house prices are unlikely to go shooting up again, but they should at least stabilise, with sales volumes returning to more normal levels.
HOUSE PRICES AND STATISTICS
This month, the most recent indices all show a small monthly fall of between 0.2% and 0.3%. Annually there is a greater disparity - their figures ranging from +0.5% to -3.8%.
Nationwide: July: Avge. price £260,828. Monthly change -0.2%. Annual change -3.8%
Halifax: July. Avge. price £285,044. Monthly change -0.3%. Annual change -2.4%
Land Registry: June: Avge. price £287,546. Monthly change 0.7%. Annual change +1.7%
Zoopla: June: Avge. price £260,500. Annual change +0.6%
Rightmove: July: Avge. price £371,907. Monthly change -0.2%. Annual change +0.5% (asking prices on Rightmove)
If you’re thinking of investing in a new property, contact us today
No Planning Required
The things you can build in your back garden
At Homesite we know most of our buyers are looking to add value to their purchases, so when a
prospective house comes up with a decent-sized garden, many will eye it up wondering what they could build
without getting tangled up in our nightmarish planning system. There are, you’ll be pleased to hear, quite a lot
of things you can do that don’t require planning permission, most of which are covered by your Permitted
Development (PD) rights. These include:
1) Rear extensions
2) Garden offices
3) Sheds
4) Greenhouses
5) Garages
6) Playhouses
7) Bike and bin sheds
8) Saunas
PD comes with a large number of restrictions (see below) but as long as you follow the rules, you can, in theory
just get on with your project. However, as it’s a complex area it would be wise, before you do anything, to
check with your local planning authority and then apply for a Lawful Development Certificate, which proves
your building is fully compliant. If you don’t and there is any doubt about the legitimacy of what you’ve built, it
can cause serious problems when you come to sell. The good news is that a Lawful Development Certificate is
relatively cheap and easy to obtain and your neighbours have very limited means to object.
Not everyone has the same PD rights – flats and maisonettes do not and, if you live in a National Park, Area of
Outstanding Natural Beauty, a Conservation Area or your home is listed, those rights can be removed or
restricted. There is also a limit on how many changes you can make using PD. Your planned new building,
along with anything that was added to the house or garden (including sheds) since 1948 must, together, not
take up more than 50% of your total garden area.
PD rules vary according to what you are building but the three main categories are listed below. Bear in mind
that these are rough guides only and you should always check the full details before you do anything.
Rear Garden Extensions
The main PD requirements are:
• They cannot extend beyond the rear of the original house by more than four metres for a detached house; or
three metres for any other house.
• They cannot exceed four metres in height, but if the extension comes within two metres of a boundary, the
height at the eaves cannot exceed three metres.
• The materials should be of a similar appearance to those on the existing exterior of the house.
• They must not, together with any other extensions or outbuilding added since 1948, take up more than half
the garden.
• You can build a larger extension of up to eight metres for a detached house; or six metres for any other
house if you apply to the local authority for Prior Approval. They will then consult with any adjoining
neighbours. If any objections are raised, they will only be taken into consideration if there is an impact on the
amenity of their property ie such things as - overlooking, overshadowing, loss of daylight or privacy.
Two storey rear extensions
The main PD requirements are:
• They will need Prior Approval (see above).
• They cannot extend beyond the rear of the original house by more than three metres and should be at least
seven metres from the rear boundary.
• The roof pitch should match the existing house.
• The overall building height should be no more than 7m.
• Together with any other extensions or outbuilding added since 1948, they must not take up more than half
the garden.
• The materials should be of a similar appearance to those on the existing exterior of the house.
Garden offices/studios
The main PD requirements are:
• These must be single storey with eaves no higher than 2.5 metres or less than 4 metres for a dual-pitched
roof or 3 metres for any other type of roof.
• The overall height must be no more than 2.5 metres if the building is within 2 metres of the boundary of the
plot.
• No verandas, balconies or raised platforms.
• Together with any other extensions or outbuilding added since 1948, they cannot take up more than half the
garden.
• They cannot be used for overnight accommodation.
Sheds, playhouses, greenhouses, garages and sauna cabins
The main PD requirements are:
• These must be single storey with eaves no higher than 2.5 metres or less than 4 metres for a dual-pitched
roof or 3 metres for any other type of roof.
• The overall height must be no more than 2.5 metres if the building is within 2 metres of the boundary of the
plot.
• No verandas, balconies or raised platforms.
• Together with any other extensions or outbuilding added since 1948, they cannot take up more than half the
garden.
Whatever you are planning on building, though, the golden rule is check with your local authority first, or you
might end up wasting a lot of money and have to take it all down again.
Links:
Planning Portal
www.planningportal.co.uk
Permitted Development
planningportal.co.uk
Lawful Development Certificates
planningportal.co.uk
Prior Approval
planningportal.co.uk

Let’s make it better
If you’re thinking about getting some work done on your house, you are not alone.
According to research from Lloyds Bank, as a nation we’re obsessed with home
improvements. A staggering 44% of us have either completed some significant home
improvements or are planning on doing so shortly.
The most common reasons cited for undertaking projects were:
To change the use of a room (32%). And our favourite target is the spare room, which we
regularly turn into an office or an extra entertaining space. Changing a room’s function is
unlikely to add any value, a fact recognised by 40% of those interviewed. However, a further
17% believed that in doing so, they had added £10,000-£25,000 and a highly optimistic 10%
were under the impression they had added between £25,000-£50,000. Nobody mentioned
that sacrificing a bedroom can just as easily reduce the value of a property.
And that brings us to our most common motivation - which is, of course, to add value (33%).
The survey reveals that it’s an area where we have a high degree of confidence in our own
abilities, as 25% of us buy properties with the intention of adding value either by updating or
extending them.
29% of home improvers claim that, as the result of the work they’d carried out, the property
was worth between £10,000 to £25,000 more. That’s not a bad return when you consider
that the average home improvement project costs just £4,000.
Our confidence can sometimes be misplaced, though, as we have a tendency to over-
estimate the value we add, especially if the work is not done to the right quality. Around 10%
of our projects go wrong, landing us with a bill that’s typically as high as £3,200. None of it
was our fault, of course, 54% of us blamed shoddy workmanship for the problems.
Reading between the lines, what the survey really shows us is that many of us, myself
included, harbour the belief that we are part-time property developers. Unfortunately, with
little real experience in the area, we are not always as good at it as we like to think we are.
Lloyds Bank takes a more diplomatic view,
Most homeowners will dabble with home improvements at some stage, whether it & is a DIY
project or a major construction. Whats important is to ensure the job is done to a high
standard as botched jobs can be quite costly to rectify. Although the reasons for home
improvements may differ from person to person, making a house a home is a key motivator