End of year market report
End of year market report
As 2024 draws to a close, it is a very mixed picture, the sales market, though, remains resilient
and some of the data is showing signs of real growth.
Zoopla is reporting that, despite affordability pressures, house prices rose by1.0% over the last 12
months. They also report the supply of properties for sale is continuing to improve, with buyer choice
now at its highest level since 2014. However, the portal warns that the increase in supply means that
the market is becoming more price sensitive and so sellers need to adjust their expectations to secure
deals.
Nationwide’s figures, on the other hand, show house prices grew by as much as 1.2% last month
alone - their fastest rate for November for two years. Annually, they were up by 3.7% and mortgage
approvals are approaching pre-pandemic levels, suggesting underlying market strength. Halifax’s
prices were up by a very similar 1.3% and 4.8% year-on-year.
Rightmove’s figures, in contrast, show a monthly fall of 1.2% and relatively sluggish annual growth of
1.2%. There are also some marked variations across the country, with northern regions generally
outperforming the southern ones in terms of both activity and price growth. The North East had the
highest annual rise at 4.2% and London came bottom at -0.8%. However, the differences between the
boroughs in the Capital are even greater than they are for the regions, with over a 10% swing
between top and bottom. Merton’s prices, for example, have risen by 7.2% over the last twelve
months, whereas Richmond’s have fallen by 3.1%.
What all the indices do agree on is that it’s first-time buyers that are currently some of the most active
as they rush to beat the change in stamp duty, whose threshold will come down from £425,000 to
£300,000 on April 1st next year.
This month’s mixed data is not unexpected in a market that is coming back to life after an election, a
gloomy budget and still adjusting to higher mortgage costs.
HOUSE PRICES AND STATISTICS
November’s indices are very mixed but should settle into a more discernible pattern in the New Year.
Nationwide: Nov: Avge. price £268,144. Monthly change +1.2%. Annual change +3.7%
Halifax: Nov: Avge. price £298,083. Monthly change +1.3%. Annual change +4.8%
Land Registry: Sept: Avge. price £291,828. Monthly change -0.3%. Annual change +2.9%
Zoopla: Oct: Avge. price £267,200. Annual change +1.0%
Rightmove: Nov: Avge. price £366,592. Monthly change -1.4%. Annual change +1.2%
RENTAL MARKET
The rental market has reached something of a turning point as growth moderates significantly.
HomeLets latest data shows average UK rents at £1,307 per month, but annual growth has
slowed to 2.2% - the lowest rate since 2021.
In London, rents now stand at £2,151 per month - up just 1.1% from last year – a dramatic fall from
the 8.7% growth recorded 12 months ago. There are, as with sales, wide regional variations, with
West Midland’s annual rise the biggest at 8.4%.
In a development that will be welcomed by many, Zoopla says the supply-demand imbalance is finally
showing signs of improving, with letting agents reporting 12% more properties available compared to
last year. However, this is still nearly a fifth below pre-pandemic levels. At the same time, demand has
normalised, coming down by 29% from last year's peak but still running 31% above pre-pandemic
levels.
Looking ahead, rents are forecast to rise by 4% in 2025, with stronger growth expected in more
affordable areas whilst major cities face increasing affordability constraints. The cumulative impact of
recent rises - adding £3,240 to average annual costs since 2021 - continue to shape market
dynamics, with almost 30% of private renters now receiving rental support through Universal Credit.
Base rate down but mortgages up
Base rate down but mortgages up
Mortgage rates were already falling when the Bank of England’s Monetary
Policy Committee voted by 8 to 1 to cut rates for the second time in 2024.
Labours spending plans though may now slow future reductions.
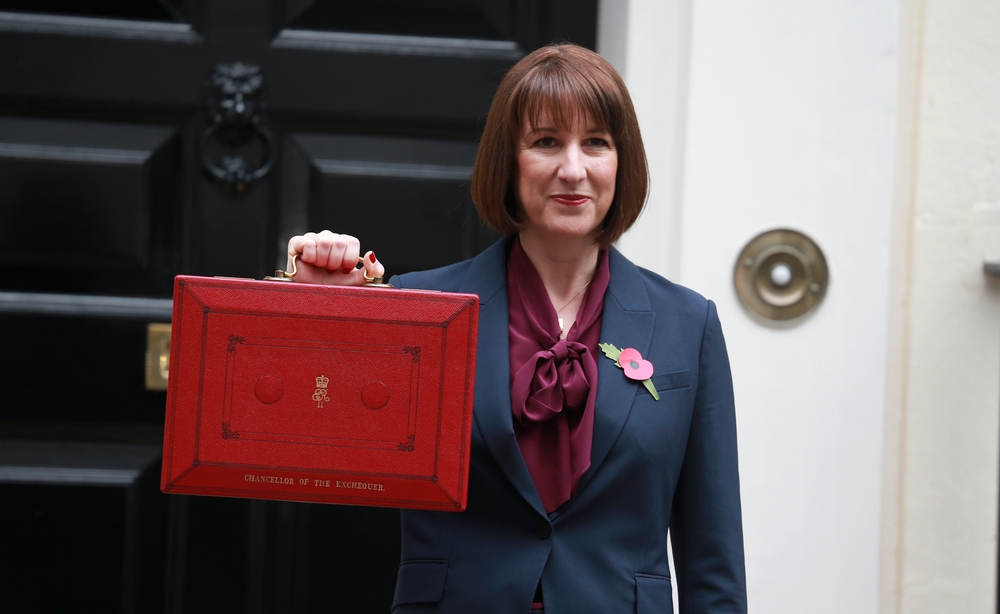
The governments official forecaster, the Office for Budget Responsibility (OBR), has
warned that mortgage rates may now remain higher than previously expected. That
is because in Rachel Reeves; budget she announced £40 billion in new taxes and
plans to borrow an extra £32.3 billion over the next five years. When the government
needs to borrow that level of money, it pushes up the cost of finance for everyone,
including mortgages for homeowners.
As a result, many of the big lenders are currently raising mortgage rates, typically by
around 0.3%, rather than cutting them. It means the Bank of Englands next interest
rate decision will be even more closely watched as it weighs up improving economic
data against the Government’s spending plans.
And, with the surprise rise in last month‘s inflation to 2.3%, the financial markets are
busy adjusting their predictions for 2025.
Most are now betting that, when Reeves’ spending plans are combined with Trump’s
election win, the base rate will now come down more slowly than originally thought
and, after it reaches 4.5%, it will then remain there for an extended period.
Below is a selection of this month’s best buys from Moneyfacts.co.uk:
Two-year fixed rates: 4.34% from Nationwide BS. Product fee £999. 60% LTV.
4.54% from first direct. Product fee £490. 60% LTV.
Three-year fixed rates: 4.29%4.29% from Nationwide BS. Product fee £999. 60%
LTV.4.39% from first direct. Product fee £490. 60% LTV.
Five-year fixed rates: 4.14% from Nationwide BS. Product fee £999. 60% LTV.
4.29% > from first direct. Product fee £490. 60% LTV.
Discounted variable: 4.49% For 2 years. From Progressive BS. Product fee £0.
75% LTV.
4.59% For 2 years. From Scottish BS. Product fee £995. 60% LTV.
BUY-TO-LET (BTL)
Best two-year fixed rate: 3.24% from The Mortgage Works. Arrangement 3.00%
Advance. 65% LTV.
Five-year fixed rate: 3.69% from The Mortgage Works. Arrangement 3.00%
Advance. 65% LTV
Best Discounted variable: 4.90% For 2 years. From Monmouthshire BS.
Arrangement 2.00% Advance. 75% LTV.
Budget Report
Budget Report
The Chancellors autumn budget has set the stage for a number of changes in
the property market, with many buyers and sellers already adjusting their
plans for the year ahead.
The increase in stamp duty for landlords and second home buyers from 3% to 5% is
already in effect, but there was some more positive news too. Capital gains tax on
residential property will remain at its current levels, and there will be a £5 billion
investment package to boost housing supply and the 95% mortgage guarantee
scheme will become permanent, offering ongoing support for first-time buyers.
Next March, however, will see the end of the current stamp duty holiday, with first-
time buyers' tax-free threshold dropping from £425,000 to £300,000, and other
buyers' threshold falling from £250,000 to £125,000. This gives buyers just a few
months to take advantage of current rates, and early signs suggest many are
planning to do just that.
The impact of the stamp duty changes will vary significantly by region. While buyers
in more expensive areas such as London and the Southeast will face higher
purchase costs post-March, those in lower-priced parts of the country will see little
change.
The new 5% stamp duty premium for buy-to-let and second homes though may deter
landlords from further investments, but those staying in the market could benefit from
robust rental demand and yields as supply levels are reduced.
In the short-term, the impact might be greater on second-home owners as they were
already nervous about being targeted for substantial rises in council tax, especially in
tourist areas.
Reeve’s plans in her budget for the housing market weren’t all about raising taxes,
though, she also announced a £5 billion house-building package, including £500
million for affordable homes and £3 billion to support smaller builders and the Build
to Rent sector. Another £1 billion has been allocated to the removal of dangerous
cladding.
It’s the kind of ambitious investment programme that many from inside and outside
the property world have been demanding for some time.
Overall, however, it was a fairly mixed budget for the sector but not as bad as many
feared. The majority are still digesting its implications and so it will be a while before
we see its true impact on the market. For first-time buyers, however, there is no time
to wait. The combination of the stamp duty deadline and the predicted mortgage rate
cuts means they are likely to be very active over the next few months. And, although
they will lose their stamp duty discount in March, the prospect of Rachel Reeves’ 1.5
million new homes should offer hope of a brighter future to all aspiring young
homeowners.

Mortgage rates are falling
Mortgage rates continue to fall as interest rate cut expectations ramp up, with
Bank of England Governor Andrew Baileys more bullish recent comments
marking a clear shift in tone.
This follows the Banks first rate reduction in four years on August 1st, when rates
were lowered to 5% from a 16-year high of 5.25%.
Major lenders including HSBC, Halifax, NatWest and Barclays have responded by
cutting mortgage rates further. While average two and five-year fixed rates remain
above 5%, at 5.38% and 5.05% respectively, a number of sub-4% deals are
available for those with a decent deposit. Swaps rates (the rates at which banks
borrow money) however have increased by around 0.4% since mid-September and
so some lenders have started increasing their rates.
The next Monetary Policy Committee (MPC) meeting is on November 7th and will be
closely monitored. Ultimately, the decision will hinge on upcoming economic data,
particularly inflation figures and labour market reports. Core inflation and services
inflation both rose in August, but wage growth has slowed to 5.1%, its lowest level in
over two years, although the war in the Middle East may well push up oil prices and
business costs.
The money markets are now factoring in one more cut in 2024 in November,
followed by several more in 2025, with the base rate finishing the year at 3.25%.
Below is a selection of this month’s best buys from Moneyfacts.co.uk:
Two-year fixed rates: 4.09% from first direct. Product fee £490. 60% LTV.
4.12% from Nationwide BS. Product fee £999. 60% LTV.
Three-year fixed rates: 4.09% from first direct. Product fee £490. 60% LTV.
4.14% from Nationwide BS. Product fee £999. 60% LTV.
Five-year fixed rates: 3.79% from first direct. Product fee £490. 60% LTV.
3.84% from Nationwide BS. Product fee £999. 60% LTV
Discounted variable: 4.49% For 2 years. From Progressive BS. Product fee £0.
75% LTV.
4.59% For 2 years. From Scottish BS. Product fee £995. 60% LTV.
BUY-TO-LET (BTL)
Best two-year fixed rate: 3.24% from The Mortgage Works. Arrangement 3.00%
Advance. 65% LTV.
Five-year fixed rate: 3.69% from The Mortgage Works. Arrangement 3.00%
Advance. 65% LTV
Best Discounted variable: 4.90% For 2 years. From Monmouthshire BS.
Arrangement 2.00% Advance. 75% LTV.

Elections & House Prices
At Homesite we like to keep you informed about everything that’s happening in the property market. Sometime towards the end of this year, there will be a general election and, no doubt, many of you will be wondering what effect this will have on house prices. We thought it would therefore be a good time to take a look at what happened during the last 8 elections, starting in April 1992, the year John Major won it for the Conservatives.
9th April 1992 - John Major (Conservatives). Avge. house price at the time - £55,166, which then rose 12% during their term in office.
In 1992 both the economy and property were in the middle of a major slump. In the run-up to the election, prices continued on their same downward path but then plummeted to a nadir of -7% in the following December before making a slow recovery over the next couple of years.
1st May 1997 - Tony Blair (Labour). Avge. price - £61,946. Then rose by 56%.
By May 1997, when Tony Blair was first elected as Prime Minister, house sales were already picking up. Prices had risen by 2.1% during the preceding 12 months. Just before the election, they slowed slightly, before taking off again, rising by as much as 5.1% in July and continuing on their upward trajectory until the next election.
7th June 2001 - Tony Blair (Labour). Avge. price - £96,499. Then rose by 61%.
Fast-forward to June 2001 - Blair was re-elected, sales were going strong and house prices were rising at an annual rate of 10%. In the months before the election, prices steadied before climbing immediately afterwards and then continued rising for several years, hitting their peak in the autumn of 2004.
5th May 2005 - Tony Blair/Gordon Brown (Labour) Avge. price - £155,533. Then rose by 10%.
Four years later, in May 2005, at the time of Blair’s third successive victory, prices were decelerating. Instead of the 20% plus rises seen in 2004, they had come down to 8.1%. In the months before and after the election, prices continued almost completely unaffected and transaction volumes actually increased. At the time people were going to the polls, the price of the average home had shot up to £155,533, an increase of over 61% since the previous election.
But then came the banking crisis of 2007/08, which provoked one of the deepest economic recessions in living memory. Bank lending dried up, the mortgage tap was turned off and, despite the base rate being slashed, the property market was thrust into five years of stagnation. The accompanying slump in house prices meant that by 2008, the cost of the average home had fallen by 16%.
6th May 2010 - David Cameron and Nick Clegg (Coalition). Avge. price - £170,846. Then rose by 14%.
By the time the next election came around, sales were moribund and prices had fallen from a pre-crash high of £190,032 (Sept 2007) to £170,846. That was, though, still 8.1% up from the previous year. In the two months prior to the election prices and sales volumes fell further before rising on the news that a coalition had been formed. It was, however, something of a false dawn, as sales were soon back in the doldrums.
It wasn’t until early 2013 that the government found a way of boosting the property market. The Funding for Lending Scheme injected billions of pounds of cheap taxpayers’ money into the banking system and most of it went on fresh mortgage lending.
7th May 2015 - David Cameron/Theresa May (Conservatives). Avge. price - £195,313. Then rose by 14%
The success of the Funding for Lending Scheme meant that by the 2015 election, house prices had reached £195,313. Growth tailed off slightly in the run-up to the election because, as in 2010, there was some uncertainty over the makeup of the next government. Once the result was known, the market picked up once again.
However, in June 2016, the UK voted to leave the EU, David Cameron resigned and Theresa May took over. After a brief pause for thought, house prices slowed rather than crashed, ending the year up 7.2% at £219,544.
8th June 2017 - Theresa May/Boris Johnson (Conservatives). Avge. price - £221,833. Then rose by 5%
Riding high in the polls and trying to push through her Brexit deal, Theresa May called an early election. As her polling worsened, house prices slowed sharply and then climbed immediately afterwards as her re-election gave some clarity of direction. However, the continuing fallout from the EU referendum and rising stamp duty costs meant any further rises were subdued, sales volumes plummeted and prices in London nose-dived.
Rows over the EU meant Theresa May didn’t last long, resigning as PM in May 2019 to be replaced by Boris Johnson. House prices had been sliding in the preceding months but then briefly returned to growth and just 7 months later there was yet another election.
12th December 2019 - Boris Johnson/Liz Truss/Rishi Sunak. Avge. price - £231,792
Long before the election was called, homeowners had been putting their plans on hold as they waited for the UK’s Brexit deal to be finalised. As a result, house prices were falling and sales volumes had dropped off the edge of a cliff. This process continued throughout the election period and then, with a deal finally signed at the end of January, there was the much-anticipated 'Boris Bounce'. But then COVID struck and we went into the first lockdown. House prices, however, boosted by Stamp Duty holidays, just kept on rising, hitting a high of £288,901 in September 2022.
The final lockdown ended in July 2021, but the boom carried on, only coming to a halt in February 2022, with the outbreak of war in Ukraine. The war brought about the cost-of-living crisis, raging inflation and soaring mortgage costs. By June of 2023, Boris had gone and just 44 days later, Liz Truss was gone, too, to be replaced by Rishi Sunak.
As we head into the next election, those financial headwinds are finally starting to recede, but only very slowly. However, the electorate appears unwilling to forgive the Tories for either the political or financial turmoil of the last few years and most would now put their money on a Labour victory in the autumn.
Current Avge. price (Feb 20224) - £280,660, a rise of 21%
So what can we deduce from this quick trip through history?
It is quite clear that the market is far more affected by the prevailing economic conditions rather than elections. However, any uncertainty over the nature of an incoming government will produce brief distortions in the market, normally around 6 weeks beforehand, after which activity and prices swiftly return to where they were pre-election.
It is encouraging to note that, however well or badly they did, in the last 32 years, every single government oversaw rises in the value of our homes during their term of office, suggesting that prices rise in spite of politics and politicians. And, even though the Conservative Party has a reputation for boosting the housing market, Labour has a far better track record, which should give some comfort to any homeowners nervous about the arrival of Keir Starmer and Co.